Weekly
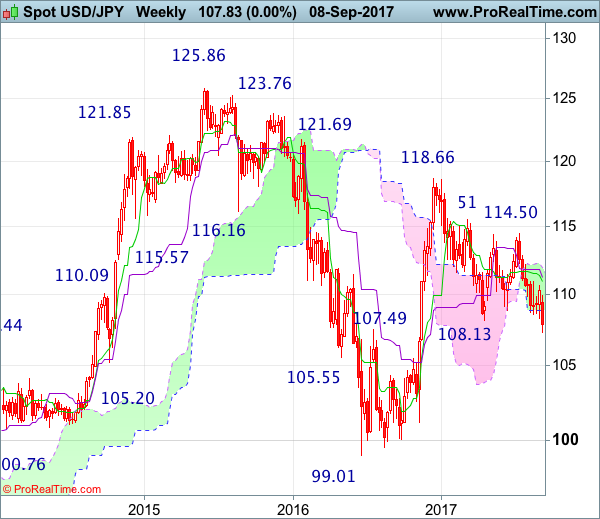
• Last Candlesticks pattern: Dark cloud cover
• Time of formation: 10 Jul 2017
• Trend bias: Down
Daily
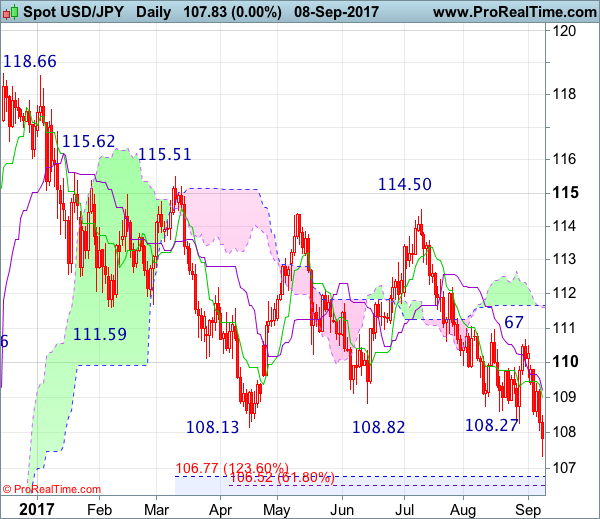
• Last Candlesticks pattern: Evening doji
• Time of formation: 7 Aug 2017
• Trend bias: Down
USD/JPY – 108.39
The greenback did meet renewed selling interest at 110.67 and dropped again (we recommended to sell at 110.55 and a short position was entered), adding credence to our bearish expectation for a resumption of recent decline, price finally penetrated support at 108.13, confirming the medium term fall from 118.66 top has resumed and downside bias remains for further weakness to 107.30-35, then 107.00, however, near term oversold condition should limit downside to 106.50-55 (61.8% Fibonacci retracement of 99.01-118.66) and 105.90-00 should hold, bring rebound later.
On the upside, whilst initial recovery to the Tenkan-Sen (now at 109.00) cannot be ruled out, reckon upside would be limited to 109.35-40 and bring another decline later. Above 109.90-95 would risk another test of said resistance at 110.67 but only a daily close above there would signal low is formed instead, bring retracement of recent decline to 110.95-05 resistance and later towards the Ichimoku cloud (now at 111.60-66).
Recommendation : Short entered at 110.55 met target at 108.55 with 200 points profit and would sell again at 110.00 for 107.00 with stop above 111.00.
On the weekly chart, despite rebounding to 110.67 the week before, dollar met renewed selling interest there and dropped last week, a black candlestick was formed and the breach of this year’s low at 108.13 adds credence to our bearish view for the resumption of recent decline from 118.66 top, hence bearishness remains for this fall to extend weakness to 117.00, then 106.50-55 (61.8% Fibonacci retracement of 99.01-118.66), however, near term oversold condition should limit downside to previous resistance at 105.53 (now support) and price should stay above 105.00, bring rebound later.
On the upside, although initial recovery to 108.90-00 cannot be ruled out, reckon upside would be limited to the Tenkan-Sen (now at 110.10) and bring another decline later. A weekly close above the Kijun-Sen (now at 110.91) would defer and suggest a temporary low is formed instead, risk rebound to the upper Kumo (now at 111.49), however, reckon resistance at 112.20 would limit upside and price should falter below 112.90-00, bring another decline later.