Weekly
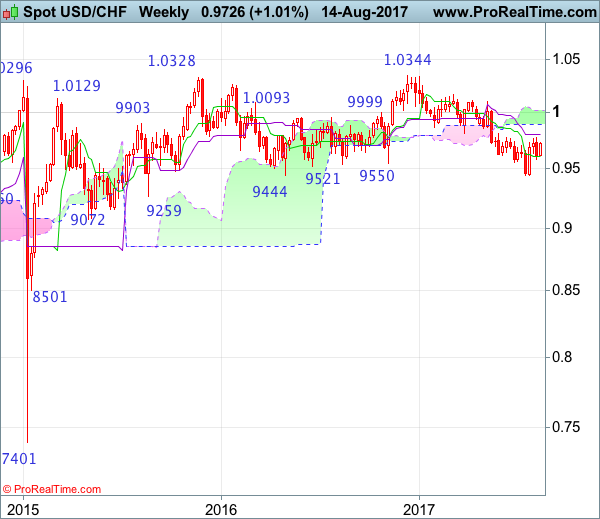
• Last Candlesticks pattern: Shooting star
• Time of formation: 7 Mar 2017
• Trend bias: Sideways
Daily
• Last Candlesticks pattern: Morning star
• Time of formation: 9 May 2017
• Trend bias: Near term up
USD/CHF – 0.9733
Although the greenback retreated to as low as 0.9583 on Friday, dollar did find renewed buying interest there and has staged a strong rebound, suggesting the retreat from 0.9773 has possibly ended there and consolidation with upside bias is seen for gain to said resistance but break there is needed to signal another leg of rise from 0.9438 low is underway for further gain to resistance at 0.9808. Looking ahead, a break above this level is needed to retain bullishness and encourage for subsequent rise to 0.9845-50 (61.8% Fibonacci retracement of 1.0100-0.9438), having said that, near term overbought condition should limit upside to 0.9900-10 and price should falter well below psychological resistance at 1.0000, bring retreat later.
On the downside, whilst initial pullback to the Tenkan-Sen (now at 0.9678) cannot be ruled out, reckon the lower Kumo (now at 0.9652) would contain downside and bring another rebound later. Below 0.9630 would risk another test of said support at 0.9583 but break there is needed to shift risk to downside for weakness to 0.9550, then towards support at 0.9490. Only a drop below this level would abort and signal the rebound from 0.9438 has ended instead, risk retest of this level, once this support is penetrated, this would indicate recent decline from 1.0344 (2016 high) has resumed and extend weakness to 0.9390-00, then towards 0.9330-40.
Recommendation: Hold long entered at 0.9600 for 0.9800 with stop below 0.9640

On the weekly chart, although dollar’s retreat from 0.9773 formed a black candlestick last week and consolidation below this level would be seen, reckon downside would be limited to 0.9580-85 and bring another rebound, above said resistance at 0.9773 would add credence to our view that a temporary low is possibly formed at 0.9438 last month, bring retracement of recent selloff to 0.9805-08 (current level of the Kijun-Sen and previous resistance), above there would provide confirmation, bring subsequent gain to 0.9845-50 (61.8% Fibonacci retracement of 1.0100-0.9438) and possibly test of the lower Kumo (now at 0.9894) but price should falter below psychological resistance at 1.0000, bring another decline later.
On the downside, expect pullback to be limited to the Tenkan-Sen (now at 0.9606) and 0.9583 should hold, bring another rise later. Only a drop below support at 0.9490 would abort and suggest the rebound from 0.9438 has ended, bring retest of this level later. Once this recent low is penetrated, this would signal the decline from 1.0344 (2016 high) is still in progress and may extend weakness to 0.9350, then towards 0.9290-00, however, loss of near term downward momentum should prevent sharp fall below 0.9250 and reckon 0.9200-10 would hold from here, risk from there has increased for a rebound later.