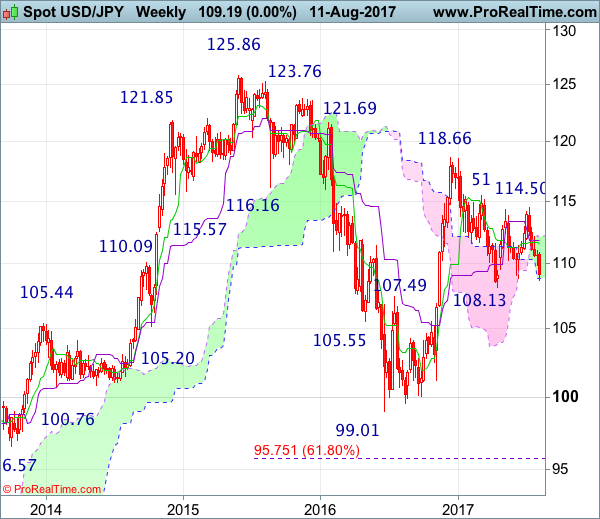
Weekly
• Last Candlesticks pattern: Dark cloud cover
• Time of formation: 10 Jul 2017
• Trend bias: Down
Daily
• Last Candlesticks pattern: Evening doji
• Time of formation: 7 Aug 2017
• Trend bias: Down
USD/JPY – 110.65
Although several hammer bullish reversal patterns were formed on the daily chart along recent selloff from 114.50 (some even followed by a long white candlestick), the greenback managed to ignore all these signs and continued heading south, suggesting bearishness remains for a test of previous support at 108.13 (this year’s low), however, break there is needed to retain bearishness and signal early decline from 118.66 top has indeed resumed and extend weakness to 107.50, then towards 106.50-55 (61.8% Fibonacci retracement of 99.01-118.66), having said that, near term oversold condition should prevent sharp fall below there and reckon previous resistance at 105.53 would hold from here.
On the upside, whilst initial recovery to the Tenkan-Sen (now at 109.90), then 110.70 is likely, reckon upside would be limited to resistance at 111.05 and bring another decline later. A daily close above the Kijun-Sen (now at 111.62) would defer and suggest a temporary low is formed instead, risk a stronger rebound to resistance at 112.20 but reckon upside would be limited to 112.40-45 and price should falter well below 113.00, bring another selloff later this month.
Recommendation : Sell again at 111.00 for 109.00 with stop above 112.00.

On the weekly chart, despite forming a doji star the week before, dollar failed to form a white candlestick last week and has dropped another (ended with another black candlestick), suggesting the selloff from 114.50 is still in progress, hence bearishness remains for another test of previous chart support at 108.13 (2017 low), however, the pair needs to penetrate this level to confirm early fall from 118.66 top has resumed and extend weakness to 117.40-50, then 117.00 but downside should be limited to 106.50-55 (61.8% Fibonacci retracement of 99.01-118.66) and previous resistance at 105.53 would turn into support, price should stay above 105.00, bring rebound later.
On the upside, although initial recovery to 110.00, then 110.50-60 cannot be ruled out, reckon resistance at 111.05 would limit upside and bring another decline later. Above the Tenkan-Sen (now at 111.62) would risk test of the Kijun-Sen (now at 111.82) but still reckon resistance at 112.20 would limit upside and bring another decline. A weekly close above resistance at 112.20 would suggest first leg of decline from 114.50 has ended instead, risk a stronger rebound to 112.90-00 but still reckon upside would be limited to 113.55-60 and price should falter well below resistance at 114.50, bring another decline later.