Weekly
• Last Candlesticks pattern: Long white candlestick
• Time of formation: 10 Jul 2017
• Trend bias: Up
Daily
• Last Candlesticks pattern: Long white candlestick
• Time of formation: 18 Jul 2017
• Trend bias: Up
As aussie met resistance again just below 0.8000 level, retaining our view that initial consolidation below recent high of 0.8066 would be seen and near term downside risk remains for retracement to 0.7877-78 (38.2% Fibonacci retracement of 0.7571-0.8066 and previous support), however, reckon 0.7815-20 (50% Fibonacci retracement) would limit downside and bring another rise later, above 0.8000 would bring retest of 0.8066 but break there is needed to confirm upmove has resumed and extend the medium term erratic rise from 0.6827 to 0.8163 resistance, then 0.8200, however, loss of near term upward momentum should limit upside and reckon another previous resistance at 0.8295 would hold.
On the downside, whilst initial pullback to 0.7877-78 cannot be ruled out, reckon 0.7815-20 would limit downside and bring another upmove later. A daily close below support at 0.7786 would bring test of 0.7760 (61.8% Fibonacci retracement of 0.7571-0.8066), however, only break of indicated support at 0.7712 would confirm top has been formed, bring retracement of recent rise to 0.7650-60 first.
Recommendation: Buy at 0.7800 for 0.8000 with stop below 0.7700.

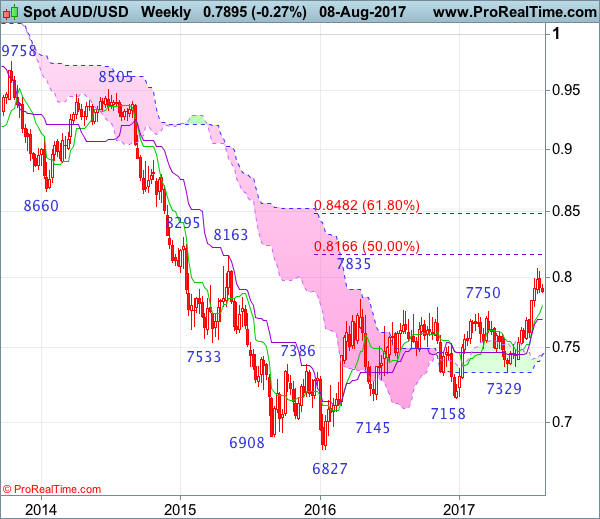
On the weekly chart, aussie’s retreat after rising to 0.8066 suggests consolidation below this level would be seen and initial downside bias is for pullback to 0.7815-20, however, reckon the Tenkan-Sen (now at 0.7794) would limit downside and bring another rise later. above 0.8000 would bring retest of 0.8066, break there would extend recent upmove from 0.6827 low to previous resistance at 0.8163, then 0.8250, however, near term overbought condition should limit upside to another previous resistance at 0.8295 and price should falter below 0.8390-00, bring retreat later.
On the downside, although initial pullback to 0.7875-80 is likely, reckon downside would be limited to previous resistance at 0.7835 (now support) and bring another rise later. Below 0.7750 would bring pullback towards previous resistance at 0.7712, break there would suggest top is possibly formed, bring test of the Kijun-Sen (now at 0.7698) but break there is needed to provide confirmation, bring further fall towards said support at 0.7571 which should remain intact.