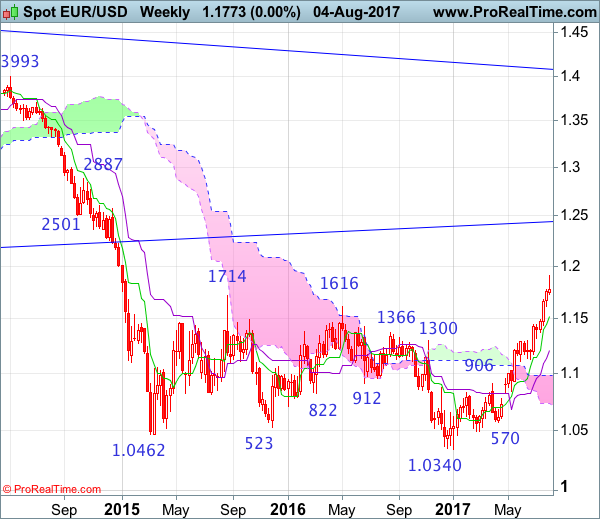
Weekly
• Last Candlesticks pattern: Shooting star
• Time of formation: 03 May 2016
• Trend bias: Down
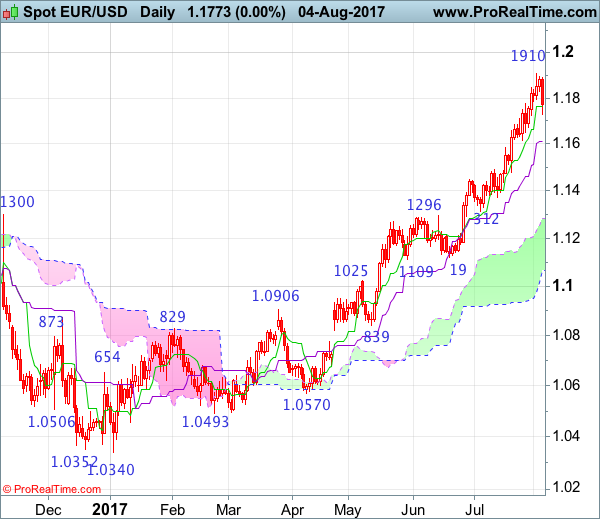
Daily
• Last Candlesticks pattern: Shooting star
• Time of formation: 3 May 2016
• Trend bias: Sideways
EUR/USD – 1.1788
Despite rising to 1.1910 last week, the subsequent retreat suggests a temporary top has possibly been formed there and consolidation below this level is in store, however, a daily close below support at 1.1723-28 is needed to add credence to this view, bring retracement of recent upmove to 1.1670-75, then towards support at 1.1613 but only a sustained breach below the Kijun-Sen (now at 1.1611) would provide confirmation, then further fall to 1.1530-35 and then 1.1500 would follow.
On the upside, although initial recovery to 1.1830 cannot be ruled out, reckon upside would be limited and price should falter below said resistance at 1.1910, bring another retreat later. A break of 1.1910 would signal recent upmove from 1.0340 is still in progress and may extend headway to 1.1950, then psychological level at 1.2000, however, loss of upward momentum should prevent sharp move beyond 1.2165 and price should falter below 1.2220-30, bring retreat later.
Recommendation: Buy at 1.1590 for 1.1790 with stop below 1.1490.
On the weekly chart, although the single currency rose to 1.1910 last week, the quick retreat from there formed a shooting star and if this week ends with a black candlestick, this would add credence to this bearish reversal pattern and suggest a temporary top is possibly formed, bring weakness to 1.1613 support, break there would signal correction of recent upmove has commenced for test of the Tenkan-Sen (now at 1.1515) and later towards 1.1435, however, ,downside should be limited to 1.1370 and support at 1.1312 should remain intact, bring rebound later.
On the upside, expect recovery to be limited to 1.1840-50 and price should falter below said resistance at 1.1910, bring retreat later. A break above said last week’s high at 1.1910 would signal the major rise from 1.0340 low is still in progress and may extend gain to 1.1950, then 1.1200, however, weakening of near term upward momentum would prevent sharp move beyond 1.2160-70 and reckon 1.2220-30 would hold, price should falter below 1.2300-10, bring another retreat later.
‘