Weekly
• Last Candlesticks pattern: Long white candlestick
• Time of formation: 10 Jul 2017
• Trend bias: Up
Daily
• Last Candlesticks pattern: Long white candlestick
• Time of formation: 18 Jul 2017
• Trend bias: Up
Although aussie edged higher to 0.8066 late last week, lack of follow through suggests consolidation would be seen and minor consolidation would be seen with initial downside bias and pullback to support at 0.7878 cannot be ruled out, however, reckon the Kijun-Sen (now at 0.7819) would limit downside and bring another rise later. Above said resistance at 0.8066 would signal upmove has once again resumed and extend the medium term erratic rise from 0.6827 to 0.8163 resistance, then 0.8200, however, loss of near term upward momentum should limit upside and reckon another previous resistance at 0.8295 would hold from here.
On the downside, whilst initial pullback to 0.7935-40 and possibly 0.7878 cannot be ruled out, reckon the Kijun-Sen (now at 0.7819) would limit downside and bring another upmove later. A daily close below the Kijun-Sen would dampen this bullish view and suggest a temporary top is possibly formed, risk test of 0.7785-90 but break of previous resistance at 0.7712 is needed to add credence to this view, bring retracement of recent rise to 0.7650-60 first.
Recommendation: Buy at 0.7840 for 0.8040 with stop below 0.7740.

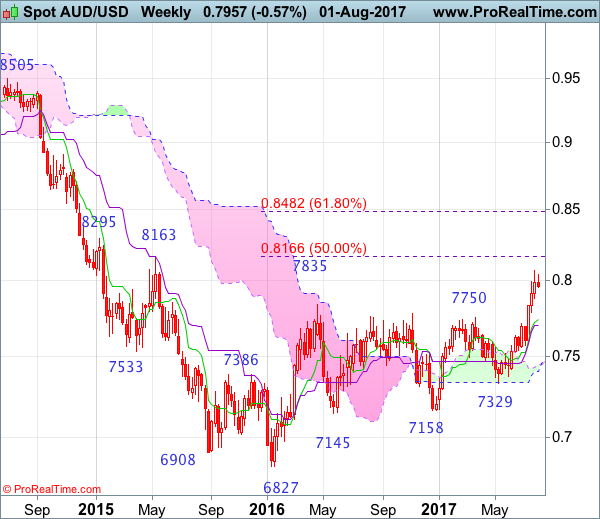
On the weekly chart, aussie’s upmove has gathered momentum after breaking above previous resistance at 0.7835, adding credence to our bullish view that the erratic rise from 0.6827 low is still in progress and upside bias remains for this move to extend headway to previous resistance at 0.8163, then 0.8250, however, near term overbought condition should limit upside to another previous resistance at 0.8295 and price should falter below 0.8390-00, bring retreat later.
On the downside, although pullback to 0.7900 is likely, reckon downside would be limited to previous resistance at 0.7835 (now support) and bring another rise later. Below 0.7785-90 would bring pullback towards previous resistance at 0.7712, break there would suggest top is possibly formed, bring test of the Kijun-Sen (now at 0.7698) but break there is needed to provide confirmation, bring further fall towards said support at 0.7571 which should remain intact.