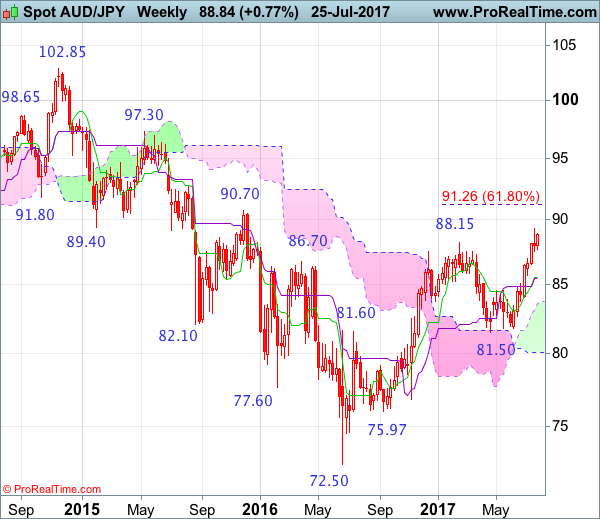
Weekly
• Last Candlesticks pattern: Shooting star
• Time of formation: 13 Mar 2017
• Trend bias: Down
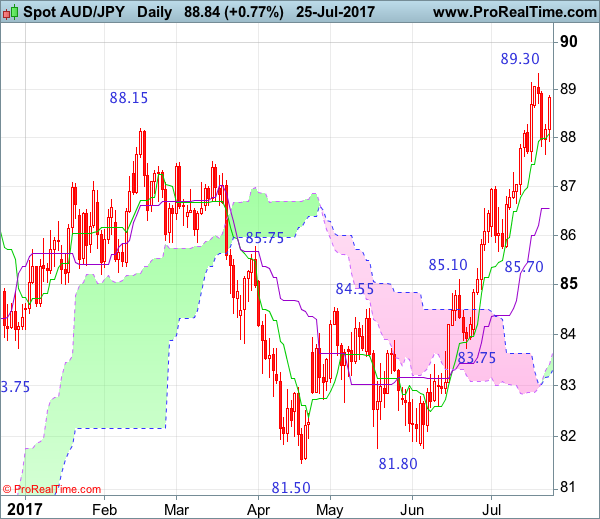
Daily
• Last Candlesticks pattern: Bearish engulfing pattern
• Time of formation: 16 Feb 2017
• Trend bias: Near term down
The Australian dollar continued surging after breaking above previous resistance at 85.10 and the subsequent breach of another previous chart point at 88.15 adds credence to our view that the medium term upmove from 2016 low of 72.50 is still in progress and bullishness is seen for this move to extend further gain to 89.30-35, then towards psychological resistance at 90.00, however, near term overbought condition should prevent sharp move beyond previous chart resistance at 90.70, risk from there is seen for a retreat to take place next month.
On the downside, whilst initial pullback to 87.60-65 is likely, reckon downside would be limited to 87.25-30 and the Kijun-Sen (now at 86.53) should hold, bring another rise later. A daily close below the Kijun-Sen would defer and suggest top is possibly formed, bring correction to 86.00 and then towards previous support at 85.70 but downside should be limited and price should stay well above 85.00-10, bring another upmove probably net week.
Recommendation: Buy at 87.30 for 89.30 with stop below 86.30.
On the weekly chart, aussie has maintained a firm undertone after recent rally above previous resistance at 88.15, adding credence to our bullish view that medium term upmove from 72.50 low (formed back in 2016) is still in progress and upside bias remains for this move to extend headway to psychological resistance at 90.00, then test of previous resistance at 90.70, however, near term overbought condition should limit upside to 91.50-60 and price should falter below another previous chart resistance at 92.70, bring correction later.
On the downside, although pullback to 88.00, then 87,.50-60 cannot be ruled out, reckon 87.00 would limi downside and bring another rise later. Below 86.50-55 would defer and risk test of the Tenkan-Sen (now at 85.55) but a weekly close below the Kijun-Sen (now at 85.41) is needed to signal a temporary top is formed instead, bring retracement of recent rise to 85.00, then 84.60-65, however, still reckon the upper Kumo (now at 83.55) would remain intact.