Weekly
• Last Candlesticks pattern: Shooting star
• Time of formation: 7 Mar 2017
• Trend bias: Sideways
Daily
• Last Candlesticks pattern: Morning star
• Time of formation: 9 May 2017
• Trend bias: Near term up
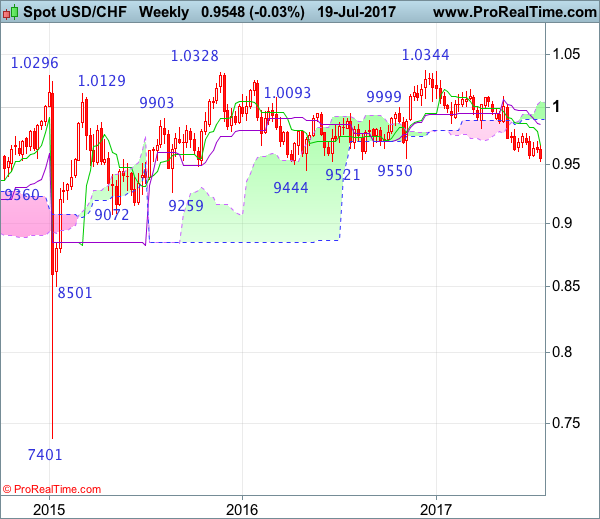
USD/CHF – 0.9551
Although the greenback did recover after holding above previous chart support at 0.9550, as renewed selling interest emerged again just above 0.9700 and dollar has fallen again, suggesting downside risk remains for recent decline from 1.0344 (2016 high) to extend weakness to psychological support at 0.9500, having said that, loss of downward momentum should prevent sharp fall below another previous chart support at 0.9444 and reckon 0.9390-00 would hold on first testing, risk from there has increased for a rebound later.
On the upside, whilst recovery to the Tenkan-Sen (now at 0.9612) cannot be ruled out, reckon upside would be limited to the the Kijun-Sen (now at 0.9647) and price should falter below resistance at 0.9701 (last week’s high), dollar shall head south again from there. A daily close above this level is needed to suggest a temporary low is possibly formed, bring a stronger rebound to 0.9738 resistance, break there would bring retracement of recent selloff to previous resistance at 0.9771 but reckon resistance at 0.9808 would hold from here.
Recommendation: Exit long entered at 0.9600 and stand aside

On the weekly chart, the greenback has fallen again after brief bounce to 0.9701 late last week, suggesting recent decline from 1.0344 (2016 high) is still in progress and downside risk remains for weakness to 0.9500, then towards another previous support at 0.9444, however, loss of near term downward momentum should prevent sharp fall below 0.9400 and reckon 0.9350 would hold from here, risk from there has increased for a rebound later.
On the upside, although initial recovery to 0.9600 and then the Tenkan-Sen (now at 0.9666) cannot be ruled out, reckon said resistance at 0.9701 would limit upside and bring another decline. A weekly close above this level would bring test of another previous resistance at 0.9771 but break there is needed to suggest a temporary low is possibly formed, then gain to 0.9808 resistance would follow. Break of this resistance would add credence to this view, bring retracement of recent decline to the Kijun-Sen (now at 0.9847) but upside should be limited to the lower Kumo (now at 0.9894) and price should falter below 1.0007 (previous resistance).