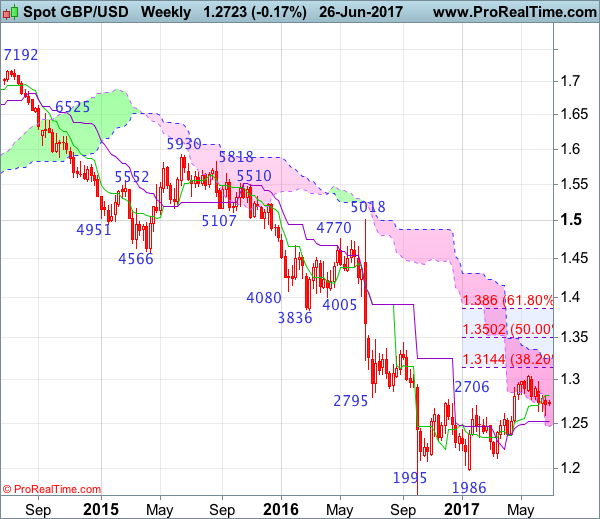
Weekly
• Last Candlesticks pattern: Long white candlestick
• Time of formation: 16 Jan 2017
• Trend bias: Down
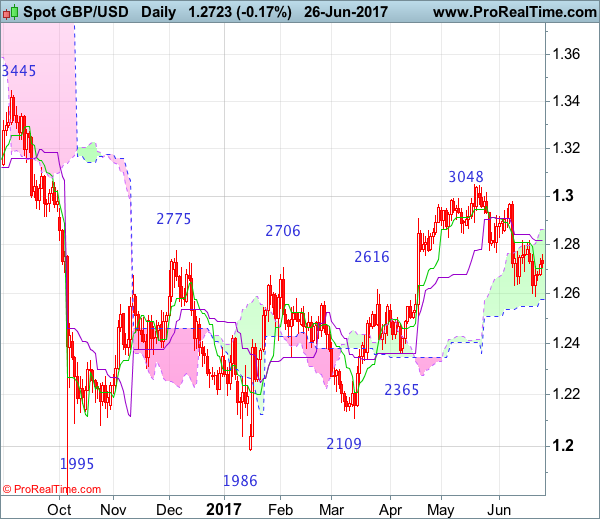
Daily
• Last Candlesticks pattern: Long white candlestick
• Time of formation: 18 Apr 2017
• Trend bias: Near term up
GBP/USD – 1.2750
Although cable resumed recent decline and fell to as low as 1.2589 (our short position entered at 1.2800 met target at 1.2600 with 200 points profit), lack of follow through selling on break of previous support at 1.2635 and the subsequent strong rebound suggest consolidation above this level would be seen and initial recovery to 1.2775-80 and possibly towards the Kijun-Sen (now at 1.2812) cannot be ruled out, however, reckon upside would be limited and 1.2860-65 would hold and price should falter well below 1.2900-10, bring another decline later.
On the downside, expect pullback to be limited to the Tenkan-Sen (now at 1.2702) and bring another rebound. Below 1.2675-80 would bring weakness to 1.2650-55 but said support at 1.2589 should hold from here, bring another rebound later. Only a drop below 1.2589 would signal recent decline from 1.3048 top has resumed and extend weakness to 1.2550, then 1.2500 support, having said that, oversold condition should limit downside to 1.2440-50 and price should stay well above key support at 1.2365, bring rebound later.
Recommendation: Hold short entered at 1.2800 for 1.2600 with stop above 1.2900.
On the weekly chart, despite cable’s anticipated fall to 1.2589 last week, the subsequent bounce from there formed a black candlestick with a long lower shadow, suggesting consolidation above this level would be seen (for 1-2 weeks) and recovery to the Tenkan-Sen (now at 1.2819) cannot be ruled out, however, reckon upside would be limited to 1.2915-20 and price should falter well below resistance at 1.2978, bring another decline later. Looking ahead, only a break of 1.2978 would signal the pullback from 1.3048 has ended instead, bring retest of this recent high, only above there would confirm the erratic upmove from 1.1986 low (2017 low) has resumed for retracement of early decline to 1.3090-00, then towards 1.3140-50 (38.2% Fibonacci retracement of 1.5018-1.1986) but price should falter well below 1.3200-10.
On the downside, whilst pullback to 1.2650-60 cannot be ruled out, price should stay well above said support at 1.2589 and bring another rebound later. Only a break of said support at 1.2589 would signal the fall from 1.3048 top is still in progress for correction of early upnove to 1.2550, however, still reckon downside would be limited and previous support at 1.2515 should remain intact, price should stay well above previous support at 1.2365, bring rebound later.