Weekly
• Last Candlesticks pattern: Shooting star
• Time of formation: 03 May 2016
• Trend bias: Down
Daily
• Last Candlesticks pattern: Shooting star
• Time of formation: 3 May 2016
• Trend bias: Sideways
EUR/USD – 1.1191
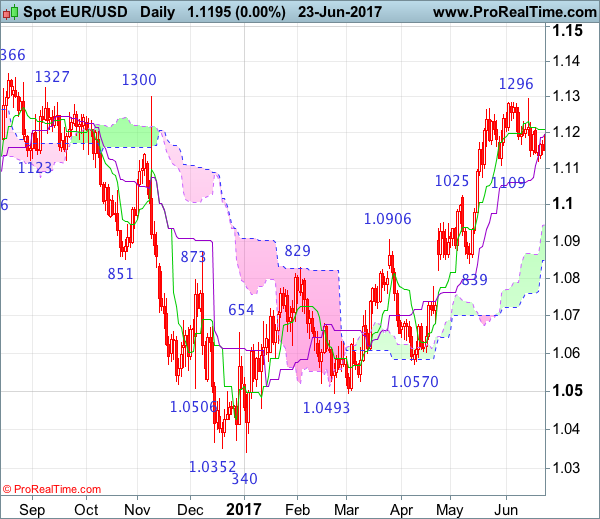
As the single currency retreated after rising to 1.1296 earlier this month, a shooting star was formed on the daily and 1-2 weeks of consolidation below this level would be seen and although initial downside risk is seen for pullback to 1.1110-20, reckon downside would be limited to 1.1020-25 and bring another rise later, above said resistance at 1.1296 would extend recent upmove from 1.0340 low to previous resistance at 1.1327, however, overbought condition should limit upside to previous chart resistance at 1.1366 and reckon 1.1440-50 would hold from here.
On the downside, whilst initial pullback to previous support at 1.1109 is likely, reckon downside would be limited to 1.1025 (previous resistance now support) and bring another rise later. Below 1.0950-60 would defer and suggest a temporary top has been formed at 1.1296 and bring correction of recent rise to 1.0900, however, still reckon downside would be limited and price should stay well above support at 1.0839.
Recommendation: Buy at 1.1025 for 1.1225 with stop below 1.0925
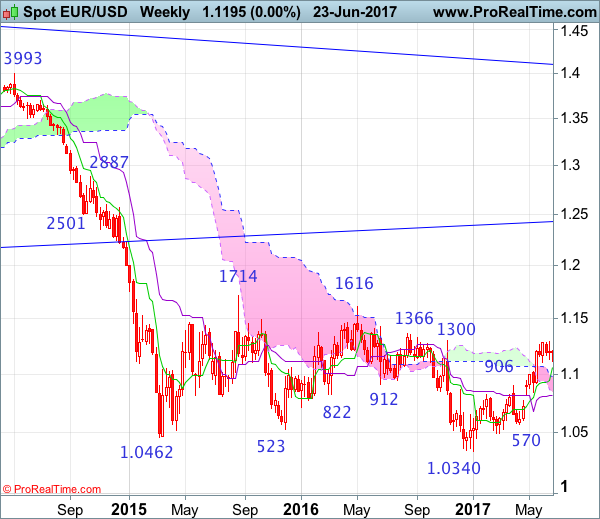
On the weekly chart, euro traded in relatively narrow range after meeting resistance at 1.1296, retaining our view that consolidation below this level would be seen and pullback to 1.1109 support cannot be ruled out, however, a weekly close below the Tenkan-Sen (now at 1.1068) is needed to suggest a temporary top is formed there, bring retracement of recent rise to the upper Kumo (now at 1.0984), then towards 1.0920-25, however, reckon downside would be limited to 1.0850-60 and previous support at 1.0839 would hold from here, bring rebound later.
On the upside, above said resistance at 1.1296-00 would signal the rise from 1.0340 low is still in progress and bring a test of previous resistance at 1.1366 but a break of this level is needed to signal early downtrend has ended at 1.0340, bring further subsequent rise to 1.1428, then towards 1.1500, having said that, price should falter well below another previous chart resistance at 1.1616.