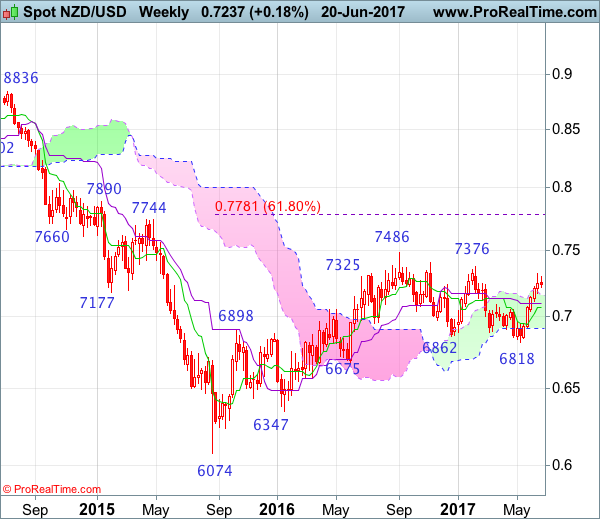
Weekly
• Last Candlesticks pattern: Shooting star
• Time of formation: 5 Sep 2016
• Trend bias: Down
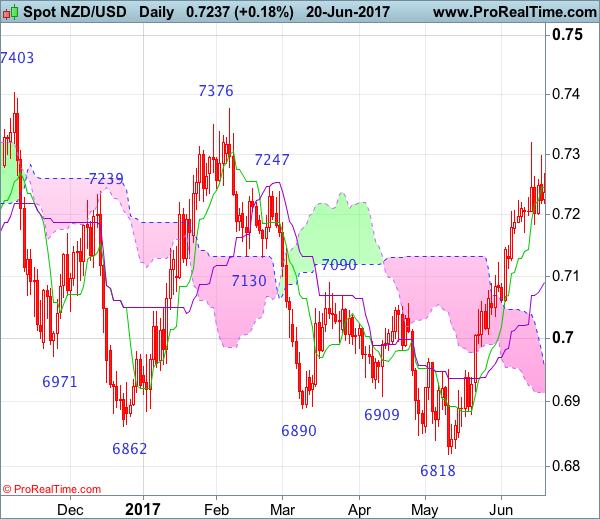
Daily
• Last Candlesticks pattern: Hammer
• Time of formation: 14 Mar 2017
• Trend bias: Near term up
NZD/USD – 0.6974
Although kiwi surged to as high as 0.7320 last week, the subsequent retreat suggests consolidation below this level would be seen and pullback to 0.7170-75 cannot be ruled out, however, reckon the Kijun-Sen (now at 0.7091) would limit downside and bring another rise later, above said resistance at 0.7320 would signal the rise from 0.6818 low has resumed and extend gain to previous resistance at 0.7376, having said that, loss of near term upward momentum should prevent sharp move beyond 0.7400 and price should falter below previous chart resistance at 0.7486.
On the downside, whilst initial pullback to 0.7170-75 cannot be ruled out, reckon downside would be limited to 0.7100 and bring another rise later. A daily close below the Kijun-Sen (now at 0.7091) would defer and suggest a temporary top is formed, bring weakness to 0.7050-55 and possibly towards 0.7005-10 but reckon downside would be limited to 0.6985-90 and previous resistance at 0.6950 should remain intact, bring another upmove later.
Recommendation: Buy at 0.7100 for 0.7300 with stop below 0.7000.
On the weekly chart, as kiwi has eased after rising to 0.7320, suggesting minor consolidation below this level would be seen and pullback to 0.7170-75, then towards 0.7100-10 cannot be ruled out, however, the Kijun-Sen (now at 0.7097) should hold and bring another rise later, above said resistance at 0.7320 would extend the rise from 0.6818 to previous resistance at 0.7376, having said that, break there is needed to retain bullishness and signal the erratic decline from 0.7486 top has ended earlier, bring subsequent headway to 0.7400-10 but price should falter below said recent high, bring retreat later.
On the downside, although pullback to 0.7170-75 is likely, reckon the Kijun-Sen (now at 0.7097) would limit downside and bring another rise later. Only below support at 0.7035 would suggest top is possibly formed, risk test of 0.7000 but downside should be limited to 0.6950 and bring another rebound later. Below 0.6915-20 would defer and suggest the rebound from 0.6818 has possibly ended instead, risk further fall to 0.6880 first but said recent low at 0.6820 should hold on initial testing.