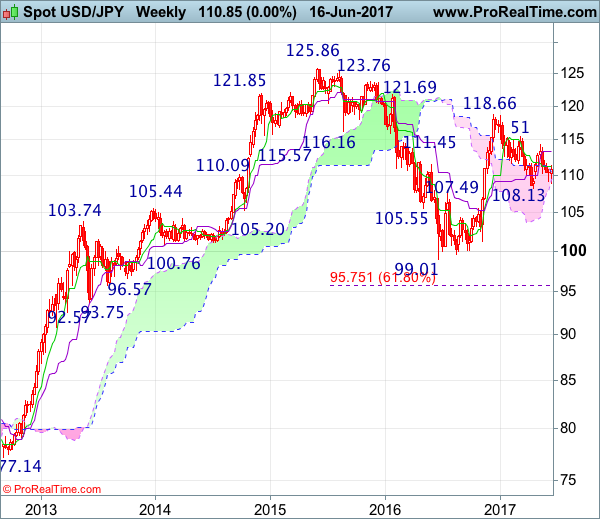
Weekly
• Last Candlesticks pattern: Marubozu
• Time of formation: 14 Nov 2016
• Trend bias: Down
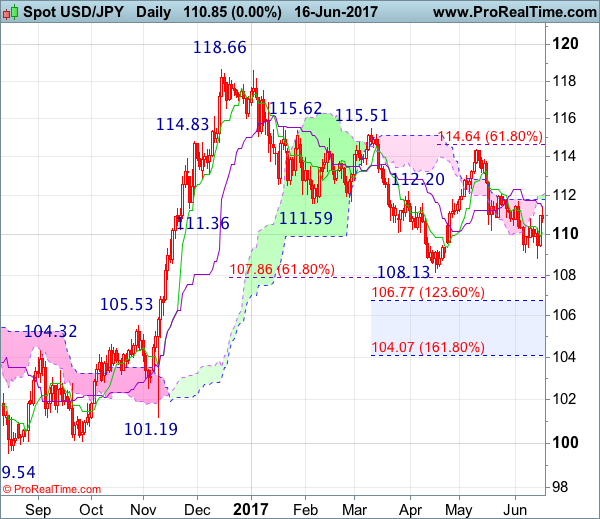
Daily
• Last Candlesticks pattern: Shooting star
• Time of formation: 15 Feb 2017
• Trend bias: Down
USD/JPY – 111.18
Although dollar fell briefly to 108.82, lack of follow through selling on break of previous support at 109.11 and the subsequent rebound suggest low has possibly been formed there and consolidation with mild upside bias is seen for gain to 111.60-65 (50% Fibonacci retracement of 114.39-108.82), however, reckon 112.25-30 (61.8% Fibonacci retracement) would hold from here, price should falter well below 113.00 and bring retreat later.
On the downside, whilst pullback to 110.65-70 is likely, reckon downside would be limited to the Tenkan-Sen (now at 110.12) and bring another rebound later. Only below said support at 108.82 would abort and signal the fall from 114.39 is still in progress and may extend weakness towards recent low at 108.13 which is likely to hold from here due to oversold condition, risk from there is seen for another rebound later.
Recommendation : Sell at 112.00 for 110.00 with stop above 113.00 or buy at 110.00 for 112.00 with stop below 109.00.
On the weekly chart, although dollar fell briefly to 108.82, as the greenback found good support there and staged a strong rebound, a white candlestick with a long lower shadow was formed, suggesting low has possibly been formed there and consolidation with upside b was is seen for test of 111.60-65 (current level of the Tenkan-Sen and 50% Fibonacci retracement of 114.39-108.82) cannot be ruled out, however, reckon upside would be limited to 112.25-30 (61.8% Fibonacci retracement), price should falter below the Kijun-Sen (now at 113.37), bring another decline later this week.
On the downside, expect pullback to be limited to 110.00-10 and bring another rise later. Below 109.85-90 would bring weakness to 109.25-30 but break there is needed to revive bearishness and signal the rebound from 108.82 has ended, bring retest of this level, break there would extend weakness to previous chart support at 108.13. Looking ahead, a drop below this level would signal the fall from 118.66 top has resumed and extend decline towards previous resistance at 107.49.