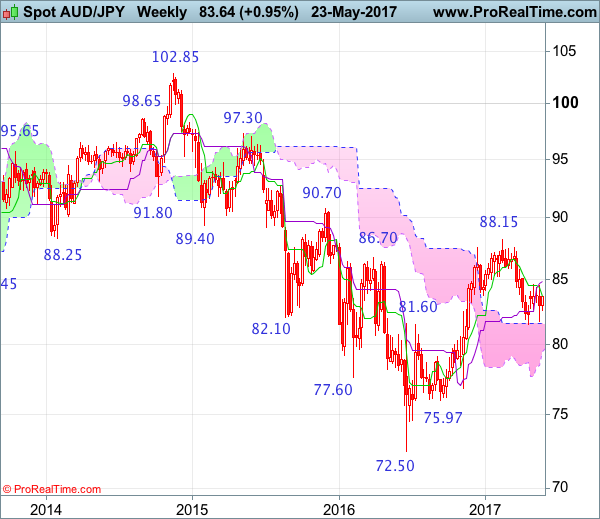
Weekly
• Last Candlesticks pattern: Shooting star
• Time of formation: 13 Mar 2017
• Trend bias: Down
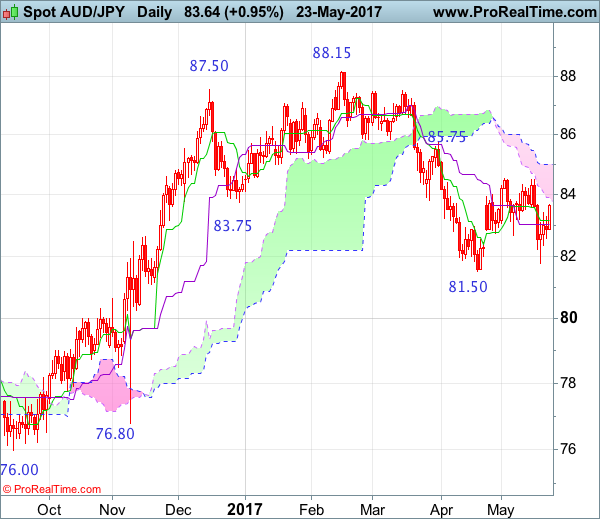
Daily
• Last Candlesticks pattern: Bearish engulfing pattern
• Time of formation: 16 Feb 2017
• Trend bias: Near term down
The Australian dollar did falter below indicated resistance at 84.55 and retreated in line with our bearish expectation, retaining our downside bias and below last week’s low at 81.80 would signal the rebound from 81.50 has ended, bring retest of this level first. A drop below this level would extend recent decline from 88.15 top to support at 81.10-15, however, near term oversold condition should limit downside and reckon 80.00 psychological support would hold from here, bring rebound later.
On the upside, whilst initial recovery to the lower Kumo (now at 83.90) cannot be ruled out, as long as said resistance at 84.55 holds, prospect of another decline to aforesaid downside targets remains. Only a break above said resistance at 84.55 would abort and suggest low is formed instead, risk a stronger rebound to 85.00-10 but said resistance at 85.75 should remain intact, bring another decline later.
Recommendation: Hold short entered at 83.65 for 81.65 with stop above 84.65.
On the weekly chart, as aussie has remained confined within near term range, suggesting further sideways trading would be seen, however, still reckon resistance at 84.55 would cap upside and bring another decline later, below last week’s low at 81.80 would signal the rebound from 81.50 has ended, bring retest of this level later. A drop below this level would extend the fall from 88.15 top to support at 81.10-15, a weekly close below there would retain bearishness and suggest the rise from 72.50 has ended, then further fall to 80.50 and possibly psychological support at 80.00 would follow.
On the upside, expect recovery to be limited to the Tenkan-Sen (now at 83.63) and bring another decline. A weekly close above resistance at 84.55 would suggest low is formed instead, bring a stronger rebound to 85.00, then towards resistance at 85.75 but only break there would abort and signal low is formed instead, bring further subsequent gain to 86.00 and then 86.50-60, however, price should falter below resistance at 87.50.