Weekly
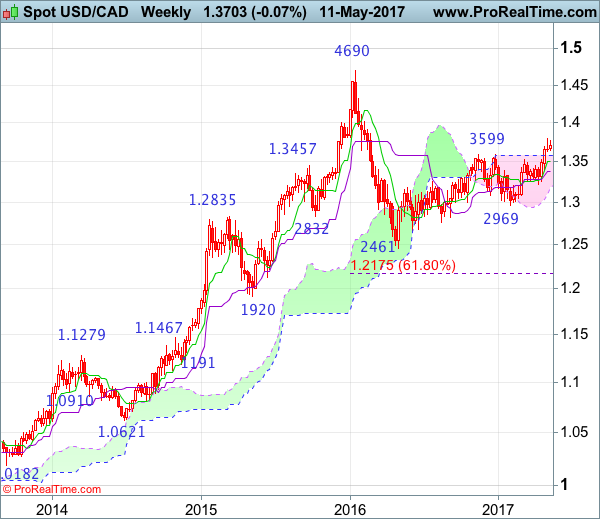
• Last Candlesticks pattern: Bullish engulfing
• Time of formation: 02 May 2016
• Trend bias: Up
Daily
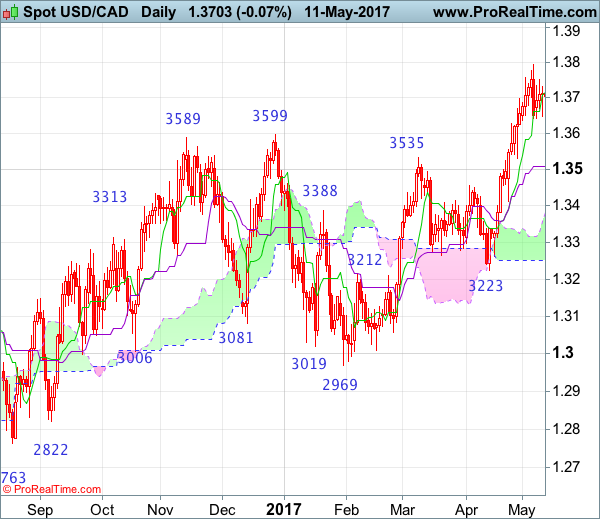
• Last Candlesticks pattern: Hammer
• Time of formation: 19 Oct 2016
• Trend bias: Up
USD/CAD – 1.3694
As the greenback has eased after rising to 1.3794 late last week, suggesting consolidation below this level would be seen, however, reckon downside would be limited to support at 1.3643 and bring another rise later, above said resistance at 1.3794 would extend recent upmove from 1.2461 low for further gain to 1.3835-40 (61.8% Fibonacci retracement of 1.4690-1.2461) and possibly towards 1.3900-10, however, near term overbought condition should prevent sharp move beyond 1.3950 and price should falter below psychological resistance at 1.4000, risk from there is seen for a retreat later.
On the downside, expect pullback to be limited to support at 1.3643 and bring another rise later to aforesaid upside targets. Below 1.3600-10 would defer and risk correction to 1.3550-60 but break of support at 1.3530 is needed to signal a temporary top is formed, bring test of the Kijun-Sen (now at 1.3509), a daily close below there would suggest recent rise has ended instead, risk deeper correction to 1.3490-00, then 1.3450-55 but price should stay well above support at 1.3411, bring a strong rebound later.
Recommendation: Hold long entered at 1.3650 for 1.3850 with stop below 1.3550.
On the weekly chart, as the greenback has maintained a firm undertone after breaking above previous resistance at 1.3599, adding credence to our bullish view that the erratic upmove from 1.2461 (2016 low) is still in progress and bullishness remains for this move to extend headway to 1.3835-40 (61.8% Fibonacci retracement of 1.4690-1.2461) and then 1.3900 but overbought condition should prevent sharp move beyond psychological resistance at 1.4000, risk from there has increased for a retreat to take place.
On the downside, although initial pullback to 1.3645-50 cannot be ruled out, reckon downside would be limited to previous resistance at 1.3599 (now support) and bring another rise later. Only below the upper Kumo (now at 1.3576) would defer and risk test of the Tenkan-Sen (now at 1.3509), break there would defer and suggest top is possibly formed, risk weakness to 1.3450, then test of support at 1.3411 but reckon the Kijun-Sen (now at 1.3382) would limit downside and bring another rise later. In the event the pair drops below the Kijun-Sen, this would suggest top is formed instead, bring weakness to 1.3300, then 1.3260-65 but reckon support at 1.3223 would remain intact.