Weekly
• Last Candlesticks pattern: Shooting star
• Time of formation: 7 Mar 2017
• Trend bias: Sideways
Daily
• Last Candlesticks pattern: Morning star
• Time of formation: 9 May 2017
• Trend bias: Near term up
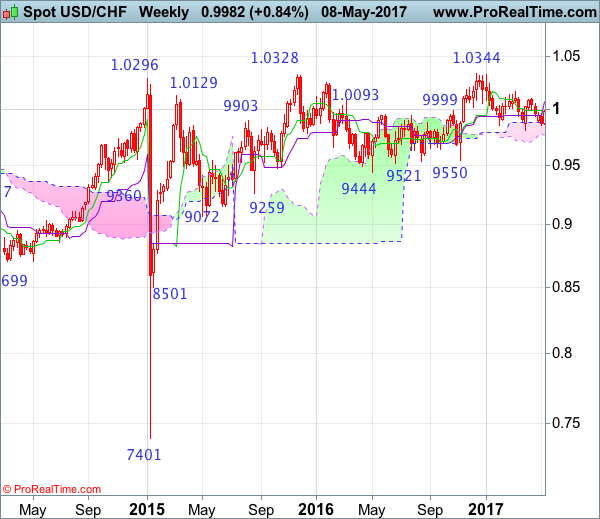
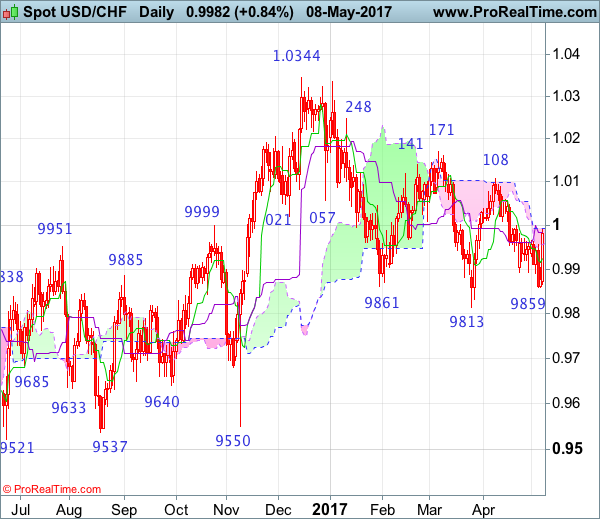
USD/CHF – 1.0009
Although the greenback fell to as low as 0.9859 late last week, the pair continued finding support there and has staged a strong rebound yesterday (formed a long white candlestick), suggesting a potential bullish reversal pattern (morning star) was formed, hence consolidation with upside bias is seen for test of 1.0067 resistance, however, a daily close above there is needed to signal the fall from 1.0108 has ended at 0.9859, bring retest of this level later. Looking ahead, only above there would signal early rise from 0.9813 (Mar low) is underway for headway to 1.0150 but resistance at 1.0171 should remain intact.
On the downside, whilst initial pullback to the Kijun-Sen (now at 0.9984) cannot be ruled out, reckon the Tenkan-Sen (now at 0.9941) would limit downside and bring another rise later. Below 0.9900-05 would risk another test of said support at 0.9859 but break there is needed to revive bearishness and extend the fall from 1.0108 to previous support at 0.9813. Looking ahead, only a drop below this support would indicate the decline from 1.0344 top has resumed instead and extend further fall to 0.9735-40 (76.4% retracement of 0.9550-1.0344) and later towards 0.9700 but reckon 0.9650-60 would hold.
Recommendation: Buy again at 0.9970 for 1.0170 with stop below 0.9870.
On the weekly chart, as the greenback found good support at 0.9859 last week and has rebounded strongly this week, suggesting the retreat from 1.0108 has possibly ended there and consolidation with upside bias is seen for gain to 1.0067, however, break of said resistance at 1.0108 is needed to retain bullishness and signal the rise from 0.9813 low has resumed for test of previous resistance at 1.0171. Looking ahead, a weekly close above there is needed to signal the fall from 1.0344 (Dec high) has ended, bring further rise to 1.0248, a sustained breach above this key level would signal early upmove has possibly resumed, bring test of 1.0335-44 resistance area, above there would provide confirmation and headway to 1.0400-10 and later 1.0500 would follow.
On the downside, although pullback to 0.9970 cannot be ruled out, reckon downside would be limited to 0.9900-10 and bring another rebound later. Below said support at 0.9859 would bring test of strong support at 0.9813 but only break of this level would abort and signal the erratic fall from 1.0344 top is still in progress, bring further decline for retracement of early upmove to 0.9735-40, then 0.9700 but reckon downside would be limited to 0.9640-50 and price should stay well above support at 0.9550.