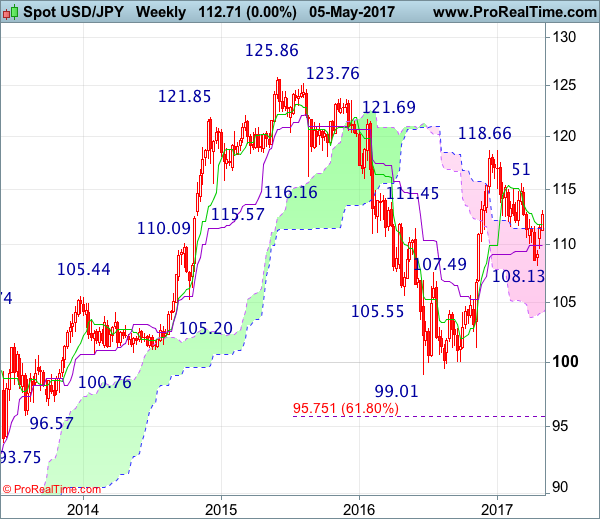
Weekly
• Last Candlesticks pattern: Marubozu
• Time of formation: 14 Nov 2016
• Trend bias: Down
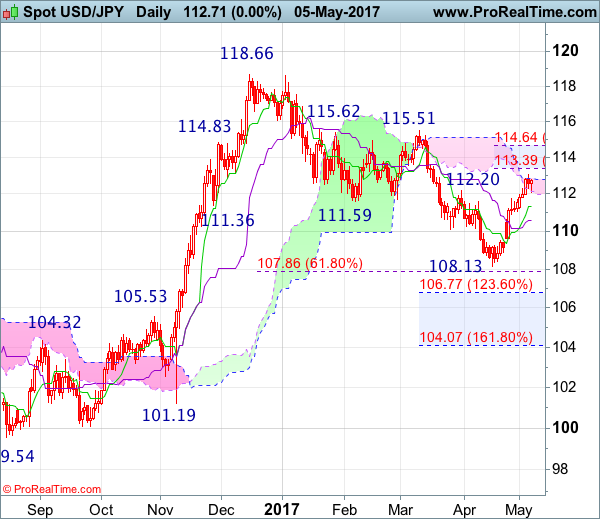
Daily
• Last Candlesticks pattern: Shooting star
• Time of formation: 15 Feb 2017
• Trend bias: Down
USD/JPY – 112.71
The greenback has maintained a firm undertone after staging a strong rebound from 108.13, suggesting this rise is still in progress for retracement of early downtrend, hence mild upside bias is seen for further gain to 113.35-40 (50% Fibonacci retracement of 118.66-108.13), then towards 114.00-10, however, reckon upside would be limited to 114.60-65 (61.8% Fibonacci retracement) and price should falter well below key resistance at 115.51, bring retreat later.
On the downside, whilst initial pullback to 112.05-10 cannot be ruled out, reckon the Tenkan-Sen (now at 111.96) would limit downside and bring another rise later. Below support at 111.04 would defer and risk test of the Kijun-Sen (now at 110.59), however, a daily close below there is needed to signal top is possibly formed, bring correction of recent upmove to 110.00 first. Only a daily close below said support at 109.59 would suggest top is possibly formed instead, bring weakness to 108.85-90 but break there is needed to signal the rebound from 108.13 has ended, then retest of this recent low would follow. Looking ahead, dollar needs to penetrate this level to revive bearishness and extend the erratic decline from 118.66 top to 107.85-90 (61.8% Fibonacci retracement of 101.19-118.66) and possibly 107.40-50.
Recommendation : Buy at 111.70 for 113.70 with stop below 110.70.
On the weekly chart, last week’s rally formed another white candlestick and current firmness adds credence to our bullish view that low has been formed at 108.13 last month, hence consolidation with upside bias remains for further gain to 113.35-40 (50% Fibonacci retracement of 118.66-108.13), then towards 114.60-65 (61.8% Fibonacci retracement), however, reckon upside would be limited and price should falter well below resistance at 115.51. Looking ahead, only a break of 115.51 would retain bullishness and signal the entire correction from 118.66 has ended at 108.13), bring further rise to 119.50, then 120.00-10 but resistance at 121.69 should remain intact.
On the downside, expect pullback to be limited to 112.00-05 and the Tenkan-Sen (now at 111.67) should hold, bring another rise later. Below last week’s low at 111.21 would defer and suggest top is possibly formed, risk weakness to 110.45-50 but only break of indicated previous support at 109.59 would add credence to this view, bring further fall to previous resistance at 109.49. A drop below this level would provide confirmation, bring weakness to 108.80-85, break there would bring retest of 108.13 support, once this level is penetrated, this would revive bearishness an extend recent selloff from 118.66 to 107.85-90 (61.8% Fibonacci retracement of 101.19-118.66), then towards 107.00, however, reckon downside would be limited to 106.50-55 (61.8% Fibonacci retracement of 99.01-119.52) and previous resistance at 105.53 (now support) should remain intact.