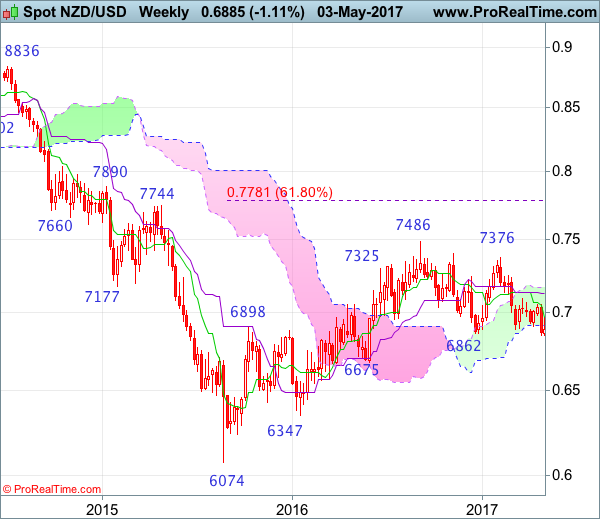
Weekly
• Last Candlesticks pattern: Shooting star
• Time of formation: 5 Sep 2016
• Trend bias: Down
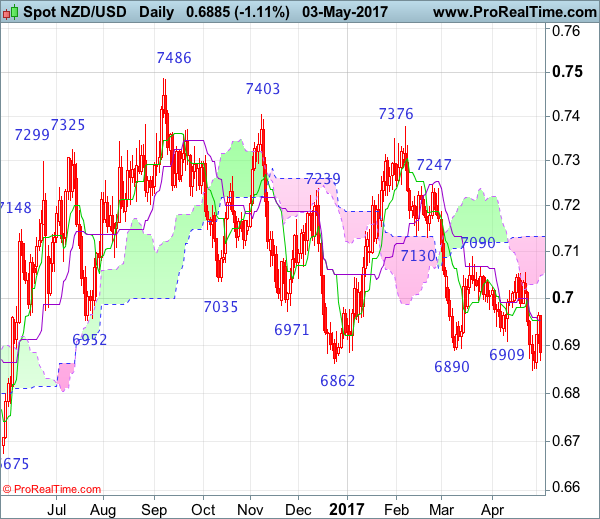
Daily
• Last Candlesticks pattern: Hammer
• Time of formation: 14 Mar 2017
• Trend bias: Near term up
NZD/USD – 0.6974
Kiwi resumed recent decline from 0.7376 and has remained under pressure, suggesting the fall from there is still in progress, hence further decline to 0.6780 (50% Fibonacci retracement of 0.6074-0.7486) would be seen, however, near term oversold condition should prevent sharp fall below 0.6700 and reckon 0.6675 support would hold from here, price should stay well above 0.6610-15 (61.8% Fibonacci retracement), risk from there is seen for a rebound to take place later.
On the upside, although initial recovery to 0.6915-20 cannot be ruled out, reckon resistance at 0.6969 would limit upside and price should falter below 0.7000, bring another decline later. Only above resistance at 0.7056 would suggest low is possibly formed instead, bring a stronger rebound to indicated resistance at 0.7090, a daily close above there would provide confirmation, bring at least a retracement of recent decline from 0.7376 to the upper Kumo (now at 0.7133), however, break there is needed to retain bullishness and encourage for further subsequent rise to 0.7185-90 but resistance at 0.7247 should remain intact.
Recommendation: Stand aside for this week.
On the weekly chart, as kiwi ran into renewed selling interest just around the Tenkan-Sen and has slipped again this week, suggesting recent fall from 0.7486 top is still in progress for further weakness to 0.6780 (50% Fibonacci retracement of 0.6074-0.7486) and later towards previous chart support at 0.6675, however, reckon downside would be limited to 0.6610-15 (61.8% Fibonacci retracement) and price should stay above 0.6550, bring rebound later.
On the upside, expect recovery to be limited to the Tenkan-Sen (now at 0.6969) and bring another decline later to aforesaid downside target. Above last week’s high at 0.7056 would abort and suggest low is formed instead, bring test of the Kijun-Sen (now at 0.7126), then towards the upper Kumo (now at 0.7171) but resistance at 0.7247 should remain intact and price should falter well below 0.7300, bring further broad consolidation later.