Weekly
• Last Candlesticks pattern: Bullish engulfing
• Time of formation: 02 May 2016
• Trend bias: Up
Daily
• Last Candlesticks pattern: Hammer
• Time of formation: 19 Oct 2016
• Trend bias: Up
USD/CAD – 1.3649
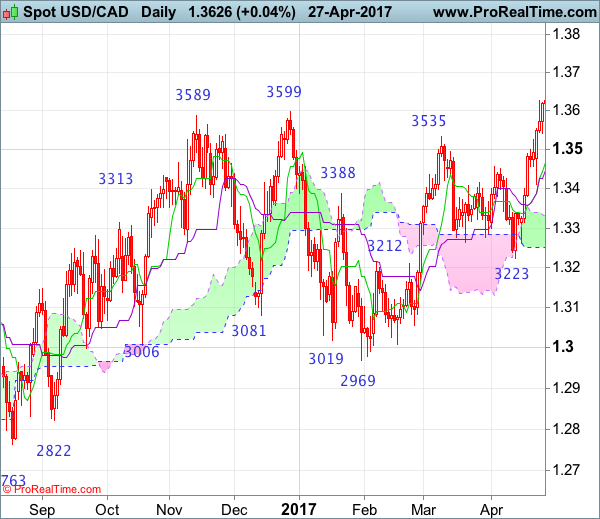
The greenback only retreated to 1.3411 early this week (just missed our long entry at 1.3400) before finding renewed buying interest and the subsequent rally above indicated resistance at 1.3535 and 1.3599 adds credence to our bullish view that early erratic upmove from 1.2461 low has resumed and may extend further gain to 1.3700-10, then 1.3750-60 but near term overbought condition should limit upside to 1.3835-40 (61.8% Fibonacci retracement of 1.4690-1.2461) and price should falter below 1.3900, risk from there is seen for a retreat later.
On the downside, whilst initial pullback to 1.3575-80 cannot be ruled out, reckon 1.3530 support would limit downside and bring another rise later. Below the Tenkan-Sen (now at 1.3467) would defer and risk test of the Kijun-Sen (now at 1.3447) but only a daily close below this level would signal top is possibly formed, bring test of support at 1.3411, once this level is penetrated, this would provide confirmation and bring retracement of recent upmove to the upper Kumo (now at 1.3331) but downside should be limited to the lower Kumo (now at 1.3252) and support at 1.3223 should remain intact.
Recommendation: Buy at 1.3500 for 1.3700 with stop below 1.3400.
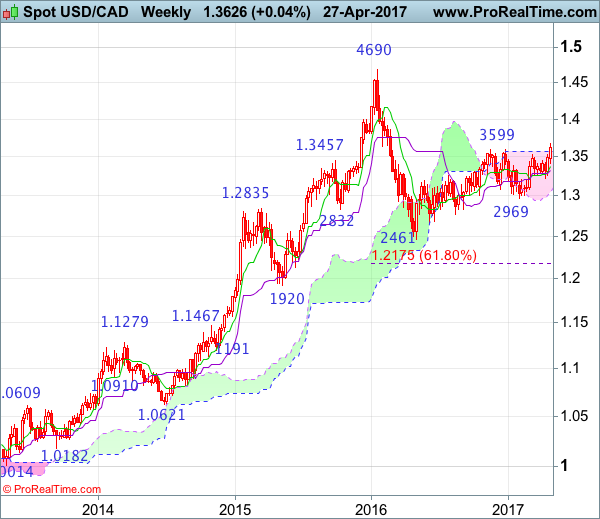
On the weekly chart, as the greenback has continued moving higher after forming a white candlestick last week and broke above indicated resistance at 1.3535 and 1.3599, adding credence to our view that the erratic upmove from 1.2461 (2016 low) has resumed and bullishness remains for this move to extend headway to 1.3700 and then 1.3770-75, however, reckon upside would be limited to 1.3835-40 (61.8% Fibonacci retracement of 1.4690-1.2461) and 1.3900 should hold, price should falter well below psychological resistance at 1.4000.
On the downside, although initial pullback to previous resistance at 1.3599 and possibly 1.3535 (another previous resistance) cannot be ruled out, reckon downside would be limited to 1.3500 and bring another rise later. A weekly close below support at 1.3411 would defer and suggest top is possibly formed, risk test of the Tenkan-Sen (now at 1.3377) but break of the Kijun-Sen (now at 1.3320) is needed to add credence to this view, bring further fall towards support at 1.3223 which is likely to hold from here.