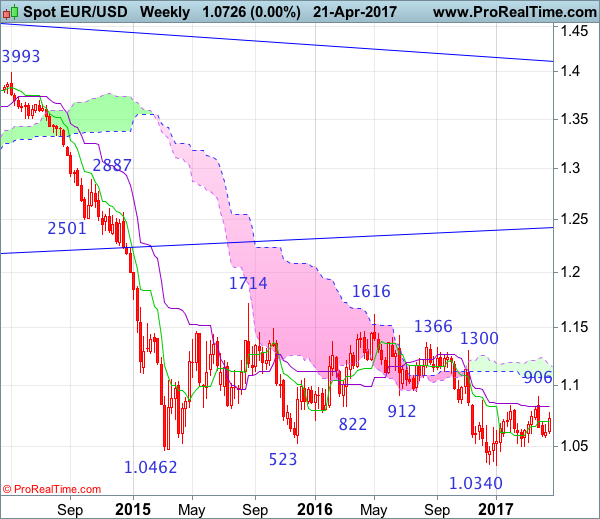
Weekly
• Last Candlesticks pattern: Shooting star
• Time of formation: 03 May 2016
• Trend bias: Down
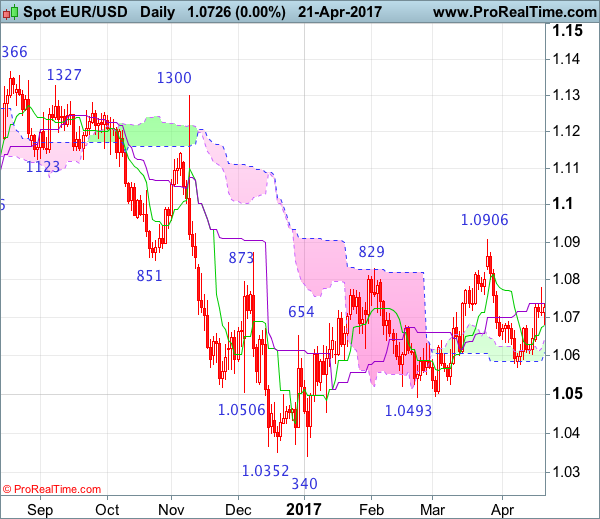
Daily
• Last Candlesticks pattern: Shooting star
• Time of formation: 3 May 2016
• Trend bias: Sideways
EUR/USD – 1.0645
Although the single currency retreated initially last week, as euro found renewed buying interest at 1.0602 and has staged a strong rebound above previous resistance at 1.0906, signaling the erratic rise from 1.0340 low is still in progress and may extend gain, above 1.0936 resistance would bring further rise to 1.1000 and then towards 1.1050-60 but upside should be limited to 1.1100 and price should falter well below previous chart resistance at 1.1300, bring selloff later.
On the downside, whilst initial pullback to 1.0775-80 cannot be ruled out, reckon downside would be limited to 1.0740-45 and support at 1.0682 should remain intact, bring another rise later. A daily close below support at 1.0682 would suggest top is possibly formed instead, bring weakness to 1.0635-40 but break of said support at 1.0602 is needed to revive bearishness and extend fall to key support at 1.0570. Looking ahead, once this level is penetrated, this would suggest the erratic rise from 1.0340 has ended, bring further fall to key support at 1.0493 which is likely to hold from here.
Recommendation: Stand aside for this week.
On the weekly chart, as the single currency opened sharply higher after last week’s strong rebound and broke above resistance at 1.0906, suggesting the erratic rise from 1.0340 low is still in progress for retracement of recent decline to 1.1000 and possibly test of the lower Kumo (now at 1.1070), however, reckon upside would be limited to the upper Kumo (now at 1.1161) and price should falter well below previous resistance at 1.1300, risk from there is seen for a retreat to take place later.
On the downside, although initial pullback to 1.0775-80 is likely, reckon downside would be limited to the Tenkan-Sen (now at 1.0716) and support at 1.0682 should hold, bring another rebound later. Only a drop below support at 1.0602 would suggest top is possibly formed, bring test of 1.0570, once this level is penetrated, this would suggest top is formed instead, bring test of indicated pivotal support at 1.0493, break there would signal the rebound from 1.0340 has ended instead, bring further fall to support at 1.0454, a sustained breach below this level would provide confirmation, then further fall to 1.0390-00 and later retest of this January low would follow.