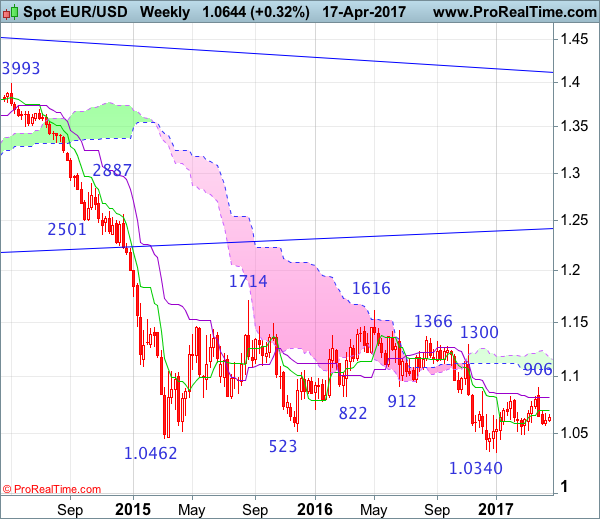
Weekly
• Last Candlesticks pattern: Shooting star
• Time of formation: 03 May 2016
• Trend bias: Down
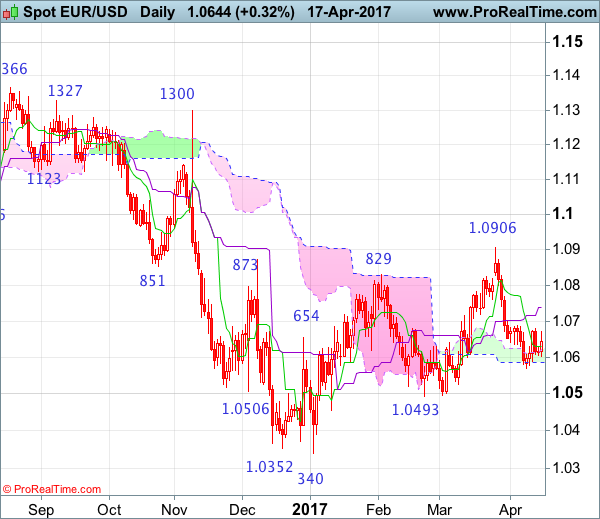
Daily
• Last Candlesticks pattern: Shooting star
• Time of formation: 3 May 2016
• Trend bias: Sideways
EUR/USD – 1.0645
As the single currency found support at 1.0570 and recovered last week, suggesting consolidation above this level would be seen and another bounce to 1.0678 resistance cannot be ruled out, however, still reckon upside would be limited to 1.0700 and bring another decline, below said support at 1.0570 would signal the fall from 1.0906 top is still in progress and extend fall to 1.0525 support but a daily close below key support at 1.0493 is needed to confirm early erratic rise from 1.0340 low (this year’s low) has ended at 1.0906, bring further fall to 1.0440-50 and possibly towards 1.0390-00, having said that, said support at 1.0340 should remain intact.
On the upside, although consolidation is seen with initial upside bias, reckon 1.0700 would limit upside and bring another decline. A daily close above the Kijun-Sen (now at 1.0738) would abort and suggest first leg of decline from 1.0906 has ended instead, risk a stronger rebound to 1.0765-70 but upside should be limited to 1.0800 and price should falter well below 1.0870-75, bring another selloff later this month.
Recommendation: Hold short entered at 1.0670 for 1.0500 with stop above 1.0770.
On the weekly chart, although the single currency found support at 1.0570 and recovered, as the selloff from 1.0906 suggests top is possibly formed there, reckon upside would be limited to the Tenkan-Sen (now at 1.0700) and bring another decline, below said support at 1.0570 would extend weakness to 1.0525. Looking ahead, only a break of indicated pivotal support at 1.0493 would signal the rebound from 1.0340 has ended at 1.0906, bring further fall to key support at 1.0454, a sustained breach below this level would provide confirmation, then further fall to 1.0390-00 and later retest of this January low would follow.
On the upside, expect recovery to be limited to the Tenkan-Sen (now at 1.0700) and brig another decline. Above 1.0730-40 would bring test of 1.0780, however, reckon upside would be limited to 1.0825-30 and price should falter well below said resistance at 1.0906, bring another decline later. Only a break of 1.0906 would revive near term bullish view for the erratic rise from 1.0340 low to bring retracement of recent decline to 1.0930-35 (61.8% Fibonacci retracement of 1.1300-1.0340) and possibly 1.1000, however, reckon upside would be limited to 1.1050-60 and price should falter below 1.1100-10, risk from there is seen for a retreat to take place later.