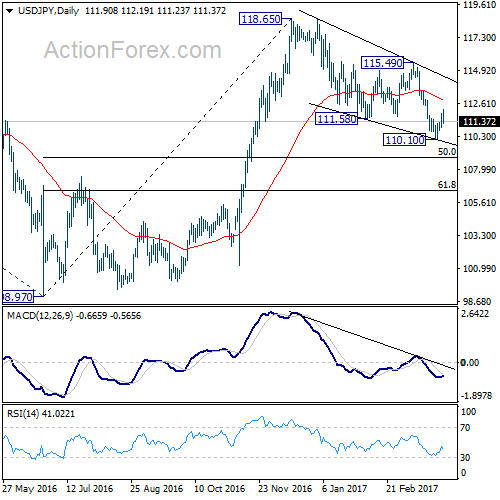
USD/JPY edged lower to 110.10 last week then recovered. Such recovery was relatively weak and was held well below 55 day EMA before losing momentum and retreated. Overall, price actions from 118.65 are seen as a corrective pattern. But there is no confirmation that such correction is finished yet.
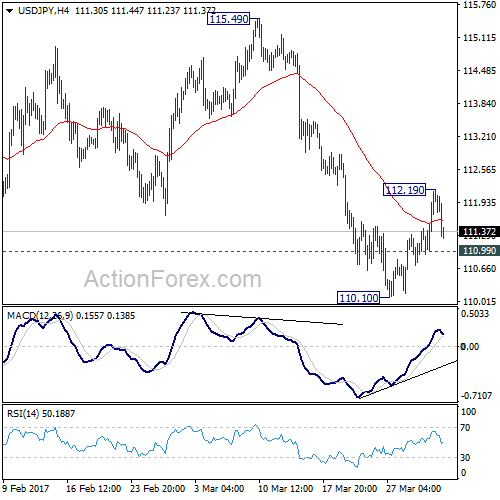
Initial bias in USD/JPY is neutral this week first. On the upside, above 112.19 will turn bias back to the upside. Sustained break of 55 day EMA (now at 112.86) will raise the chance of near term reversal and target 115.49 resistance for confirmation. On the downside, though, below 110.99 minor support will turn bias back to the downside for 110.10 and break will extend the corrective fall from 118.65.
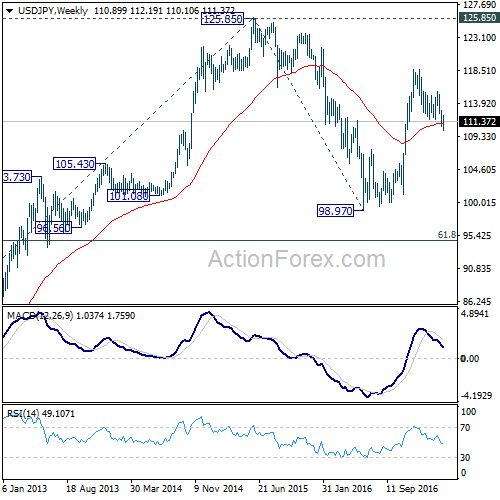
In the bigger picture, price actions from 125.85 high are seen as a corrective pattern. The impulsive structure of the rise from 98.97 suggests that the correction is completed and larger up trend is resuming. Decisive break of 125.85 will confirm and target 61.8% projection of 75.56 to 125.85 from 98.97 at 130.04 and then 135.20 long term resistance. Nonetheless, sustained trading below 55 week EMA (now at 111.08) will extend the consolidation from 125.85 with another fall through 98.97 before completion.
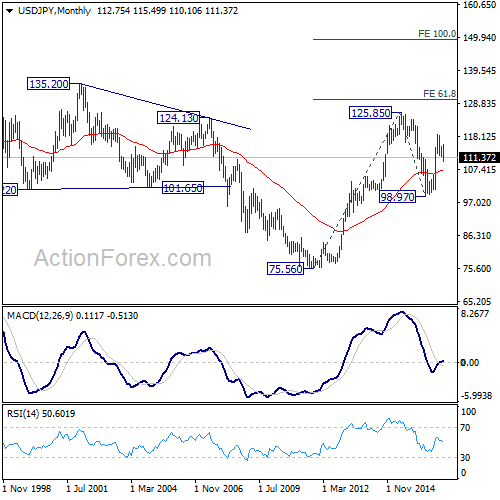
In the long term picture, the rise from 75.56 long term bottom to 125.85 medium term top is viewed as an impulsive move. Price actions from 125.85 are seen as a corrective move which could still extend. But, up trend from 75.56 is expected to resume at a later stage for above 135.20/147.68 resistance zone.