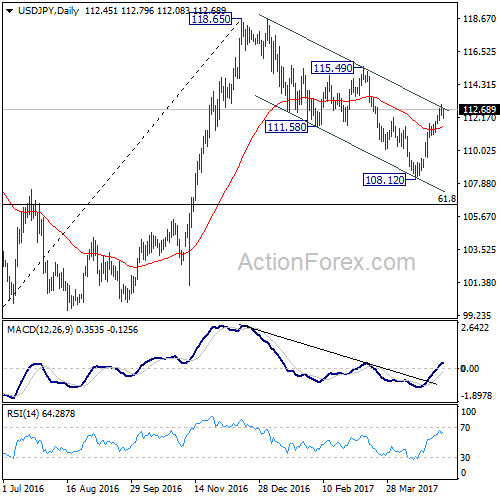
USD/JPY’s rally from 108.12 extended to as high as 113.04 last week. It formed a temporary top there after hitting channel resistance. But still, we’d holding on to the view that corrective fall from 118.65 could be completed with three waves down to 108.12. Rise from 108.12 is expected resume later through 115.49 resistance.
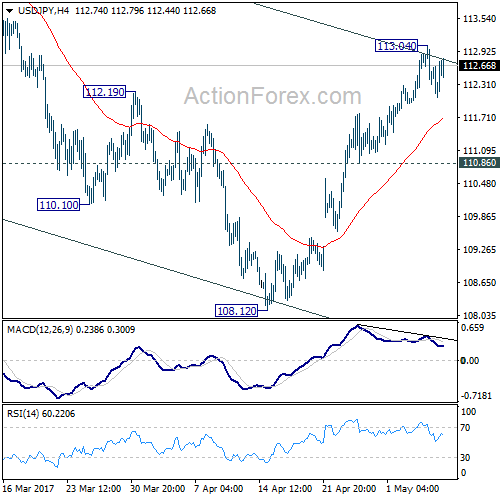
Initial bias in USD/JPY remains neutral this week for consolidation below 113.04 temporary top. Further rise is still expected as long as 110.86 support holds. Above 113.04 will target 115.49 resistance. Firm break there will resume larger rally from 98.97 to 125.85 high. However, break of 110.86 support will keep USD/JPY inside near term falling channel and will turn bias back to the downside for 108.12 and below to extend the decline from 118.65.
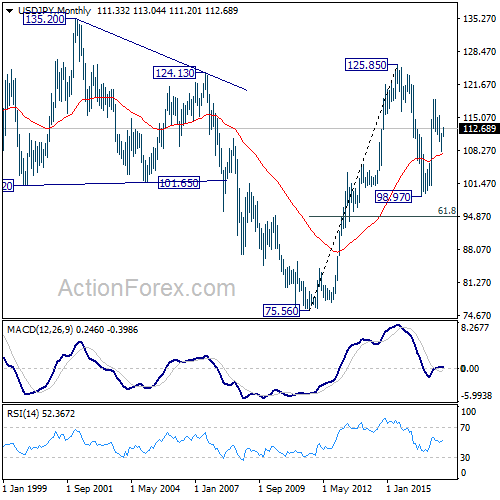
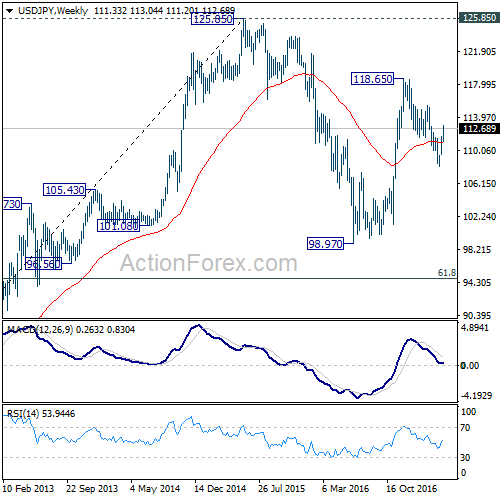
In the bigger picture, price actions from 125.85 high are seen as a corrective pattern. It’s uncertain whether it’s completed yet. But in case of another fall, downside should be contained by 61.8% retracement of 75.56 to 125.85 at 94.77 to bring rebound. Meanwhile, break of 115.49 resistance will extend the rise from 98.97 to retest 125.85. Overall, rise from 75.56 is still expected to resume later after the correction from 125.85 completes.
In the long term picture, the rise from 75.56 long term bottom to 125.85 medium term top is viewed as an impulsive move. Price actions from 125.85 are seen as a corrective move which could still extend. But, up trend from 75.56 is expected to resume at a later stage for above 135.20/147.68 resistance zone.