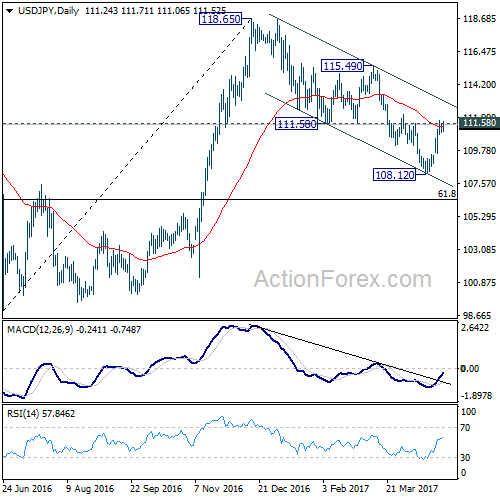
USD/JPY rebounded strongly last week and breached 111.58 support turned resistance. The development argues that corrective fall from 118.65 could be completed with three waves down to 108.12. But, we’d prefer to see sustained trading above 111.58 to confirm it. This will be the focus this week.
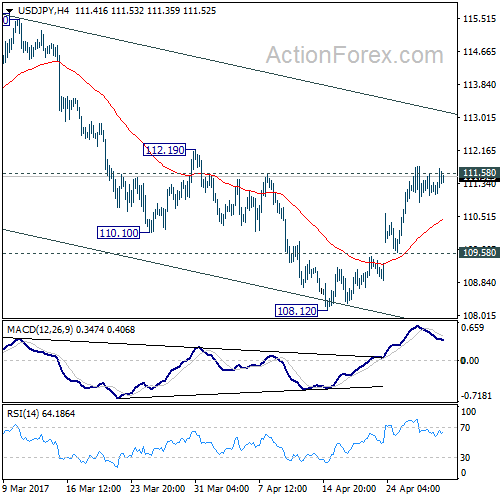
Initial bias in USD/JPY is neutral this week first. As long as 109.58 minor support intact, further rise is still expected. Sustained trading above 111.58 support turned resistance will indicate that fall from 118.65 is merely a corrective move and has completed. Outlook will then be turned bullish for 115.49 resistance and above. However, break of 109.58 will argue that fall from 118.65 is still in progress and will turn bias to the downside for 108.12 and below.
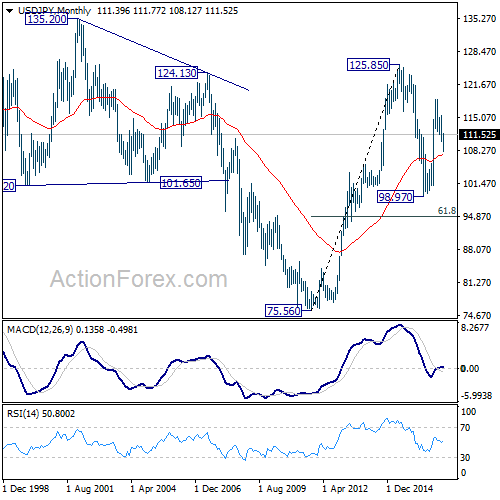
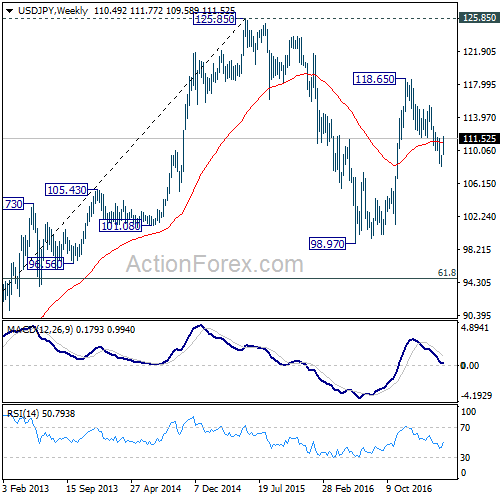
In the bigger picture, price actions from 125.85 high are seen as a corrective pattern. It’s uncertain whether it’s completed yet. But in case of another fall, downside should be contained by 61.8% retracement of 75.56 to 125.85 at 94.77 to bring rebound. Meanwhile, break of 115.49 resistance will extend the rise from 98.97 to retest 125.85. Overall, rise from 75.56 is still expected to resume later after the correction from 125.85 completes.
In the long term picture, the rise from 75.56 long term bottom to 125.85 medium term top is viewed as an impulsive move. Price actions from 125.85 are seen as a corrective move which could still extend. But, up trend from 75.56 is expected to resume at a later stage for above 135.20/147.68 resistance zone.