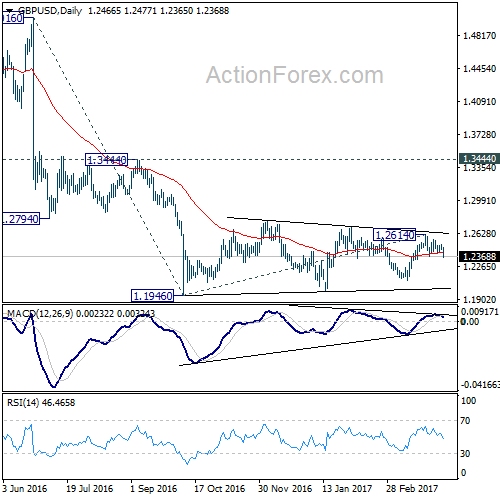
GBP/USD’s sharp fall and break of 1.2376 support last week should confirm completion of rise from 1.2108 at 1.2614. More importantly, the triangle pattern from 1.1946 could be finished with five waves to 1.2614 too. And the larger down trend is resuming. Deeper fall should be seen back to 1.2108 support to confirm this bearish case.
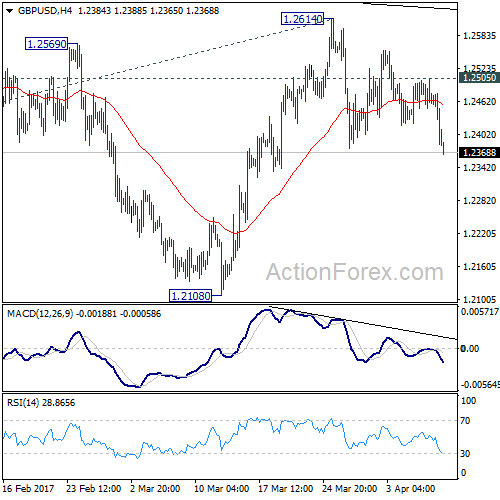
Initial bias in GBP/USD remains on the downside this week for 1.2108 support first. Decisive break there will argue that medium term down trend is resuming. In that case, GBP/USD should take out 1.1946/1986 support zone to 61.8% projection of 1.5016 to 1.1946 from 1.2614 at 1.0717. On the upside, however, break of 1.2505 resistance will invalidate this immediately bearish case. Then, it will turn bias back to the upside for 1.2614 resistance instead.
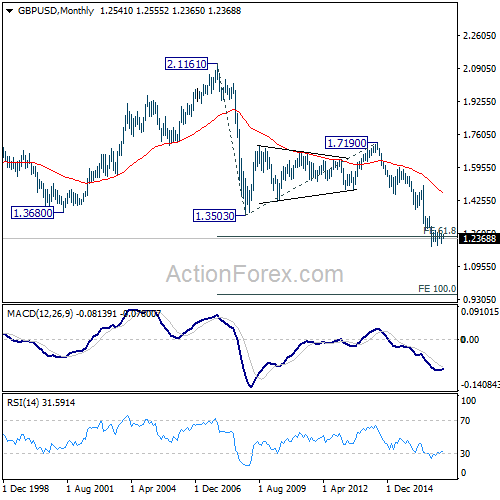
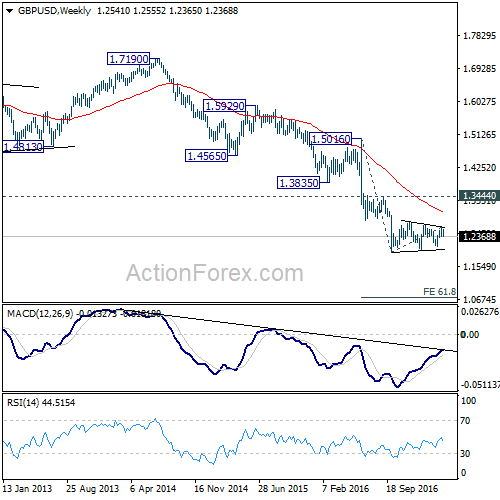
In the bigger picture, fall from 1.7190 is seen as part of the down trend from 2.1161. There is no sign of medium term reversal yet. Sustained trading below 61.8% projection of 2.1161 to 1.3503 from 1.7190 at 1.2457 will target 100% projection at 0.9532. Overall, break of 1.3444 resistance is needed to confirm medium term bottoming. Otherwise, outlook will remain bearish.
In the longer term picture, no change in the view that down trend from 2.1161 is still in progress. Current momentum suggests that the down trend will go deeper than originally expected to 100% projection of 2.1161 to 1.3503 from 1.7190 at 0.9532.