GBP/USD rebounded to as high as 1.2530 last week but lost momentum since then. Overall outlook is unchanged that price actions from 1.1946 are developing into consolidation pattern with 1.2108 as another leg. While such consolidation could extend, the larger down trend is expected to resume at a later stage.
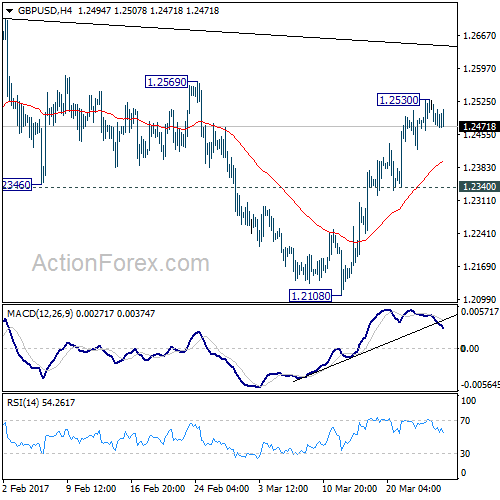
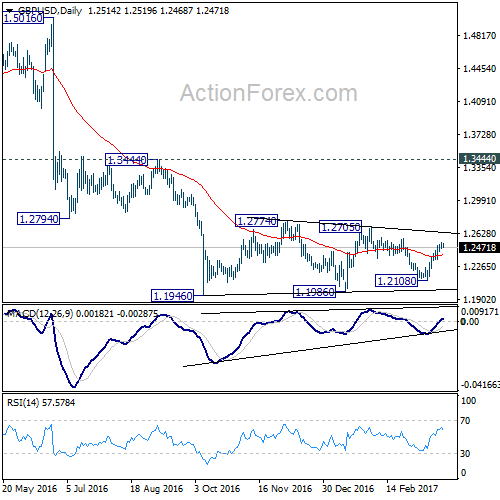
Initial bias in GBP/USD is neutral this week first. On the upside, above 1.2530 will target 1.2705/74 resistance zone. But we’d expect strong resistance from 1.2705/2774 resistance zone to limit upside and bring down trend resumption. On the downside, break of 1.2340 support will turn bias back to the downside for 1.2108 support. Though, sustained break of 1.2774 will extend the rise towards 1.3444 key resistance level.
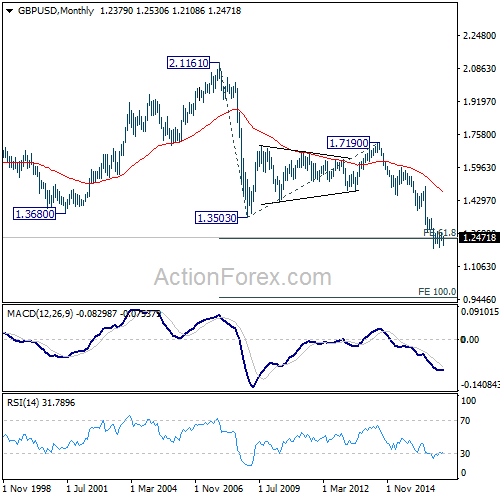
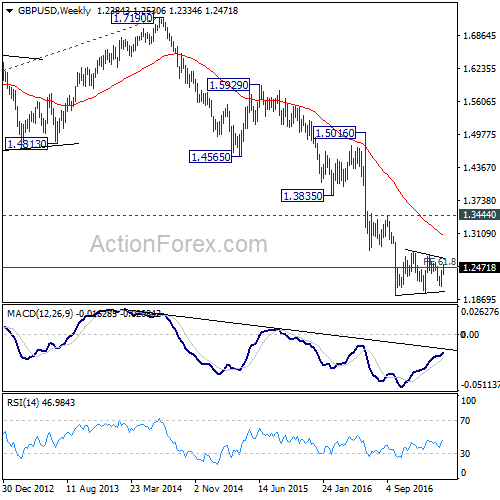
In the bigger picture, fall from 1.7190 is seen as part of the down trend from 2.1161. There is no sign of medium term reversal yet. Sustained trading below 61.8% projection of 2.1161 to 1.3503 from 1.7190 at 1.2457 will target 100% projection at 0.9532. Overall, break of 1.3444 resistance is needed to confirm medium term bottoming. Otherwise, outlook will remain bearish.
In the longer term picture, no change in the view that down trend from 2.1161 is still in progress. Current momentum suggests that the down trend will go deeper than originally expected to 100% projection of 2.1161 to 1.3503 from 1.7190 at 0.9532.