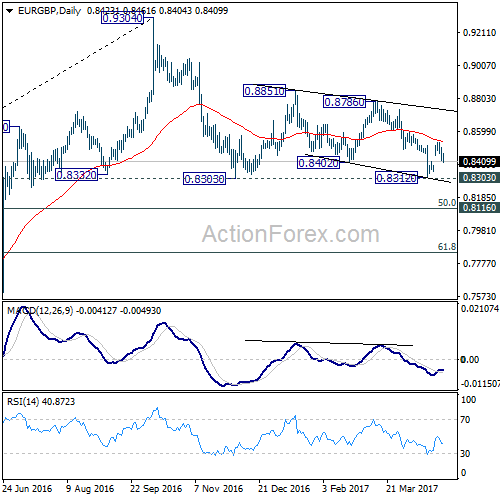
Despite rebounding to 0.8529 last week, EUR/GBP quickly lost momentum and reversed. The development now suggests that fall from 0.8786 could be resuming. And focus is back to 0.8303/12 support zone in near term. Overall, price actions form 0.9304 is seen as a corrective pattern that is extending.
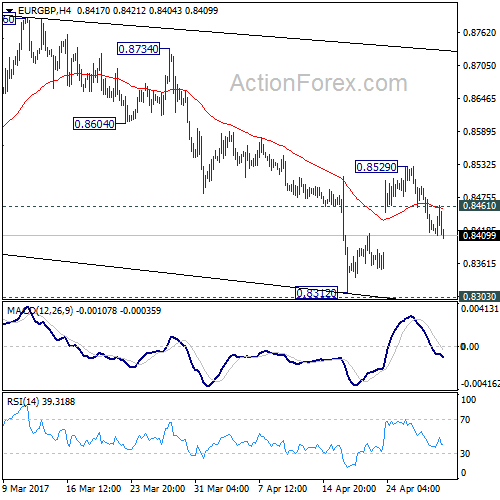
Initial bias in EUR/GBP is mildly on the downside this week for 0.8303/12 support zone. Break there will extend the corrective fall from 0.9304 to to 0.8116/20 cluster support. We’d expect strong support from there to bring rebound. On the upside, above 0.8461 minor resistance will turn bias to the upside for 0.8529. Break will resume the rebound from 0.8312 and target 0.8786 resistance.
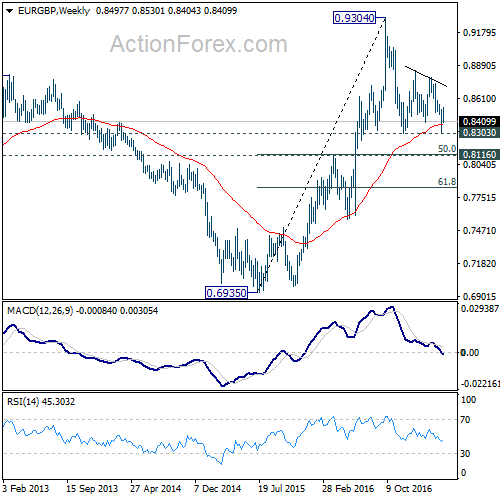
In the bigger picture, price actions from 0.9304 are viewed as a medium term corrective pattern. In case of deeper fall, we’d expect strong support from 0.8116 cluster support (50% retracement of 0.6935 to 0.9304 at 0.8120) to contain downside. Rise from 0.6935 (2015 low) will resume at a later stage to 0.9799 (2008 high). However, sustained break of 0.8116 could bring deeper decline to next key support level at 0.7564 before the correction completes.
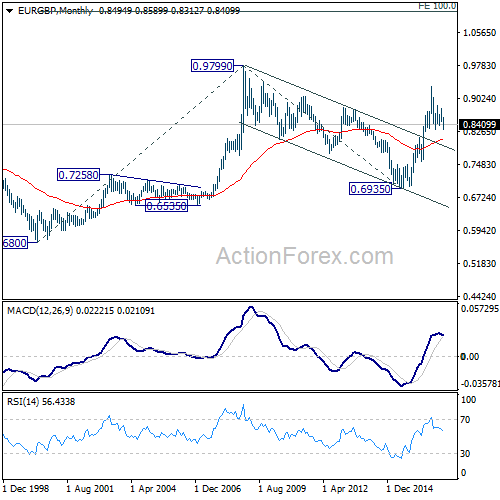
In the long term picture, firstly, price action from 0.9799 (2008 high) is seen as a long term corrective pattern and should have completed at 0.6935 (2015 low). Secondly, rise from 0.6935 is likely resuming up trend from 0.5680 (2000 low). Thirdly, this is supported by the impulsive structure of the rise from 0.6935 to 0.9304. Hence, after the correction from 0.9304 completes, we’d expect another medium term up trend to target 0.9799 high and above.