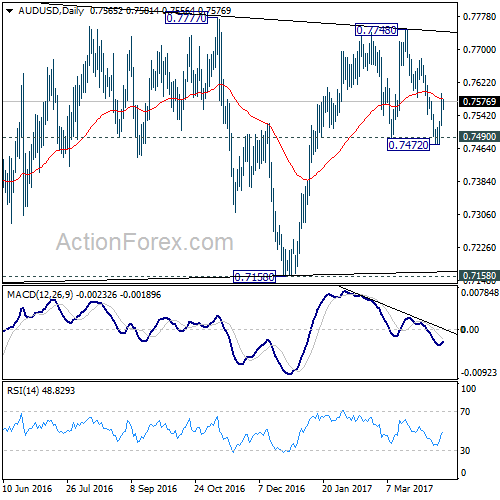
AUD/USD dipped to 0.7472 last week but failed to sustain below 0.7490 support and rebounded. The development argues that rise from 0.7158 is possibly not completed yet. And another rally could be seen through 0.7748 resistance to test key long term fibonacci level at 0.7849.
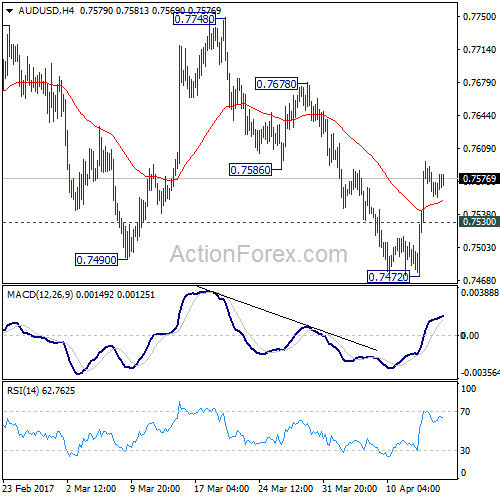
Initial bias in AUD/USD is mildly on the upside this week for 0.7678 resistance. Break there will confirm completion of the pull back from 0.7748. And rise from 0.7158 would be resuming. AUD/USD should target 0.7748 and above next. On the downside, below 0.7530 minor support will turn bias neutral again, with focus back on 0.7472 support.
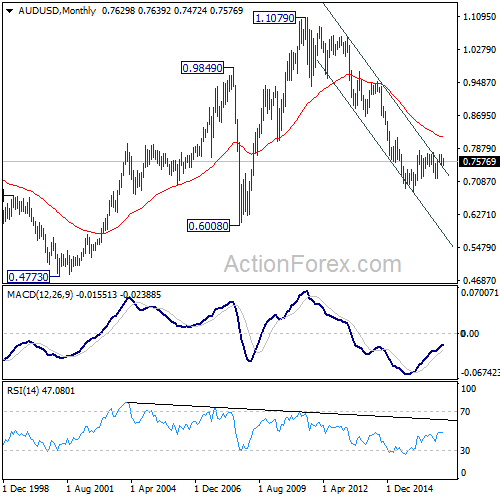
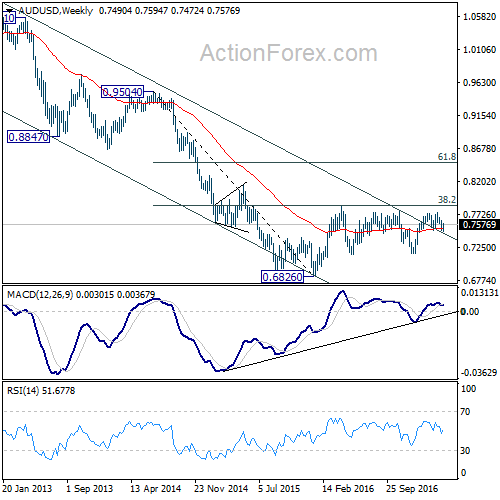
In the bigger picture, we’re still treating price actions from 0.6826 low as a correction. And, as long as 38.2% retracement of 0.9504 to 0.6826 at 0.7849 holds, long term down trend from 1.1079 is expected to resume sooner or later. Break of 0.6826 low will target 0.6008 key support level. However, firm break of 0.7849 will indicate that rise from 0.6826 is developing into a medium term rebound, rather than a sideway pattern. In such case, stronger rise should be seen to 55 month EMA (now at 0.8144) and above.
In the longer term picture, while the down trend from 1.1079 might extend lower, we’re not anticipating a break of 0.6008 (2008 low) yet. We’ll look for bottoming above there to reverse the medium term trend.