Unlike support and resistance levels, trendlines are drawn at an angle. These widely used technical lines are, first and foremost, used to determine the trend. By drawing these lines one can establish whether a market is in the process of rallying north (an uptrend), dropping south (a downtrend) or in the phase of a consolidation.
However, not all technicians draw these lines in the same manner. Like all things trading, we prefer to keep it simple. At least two swing highs or lows are needed to draw a trendline. The more times a line is respected, nevertheless, the more valid it becomes.
Ascending trendlines
An ascending trendline has a rising angle. As long as price remains above the trendline, the uptrend is considered intact.
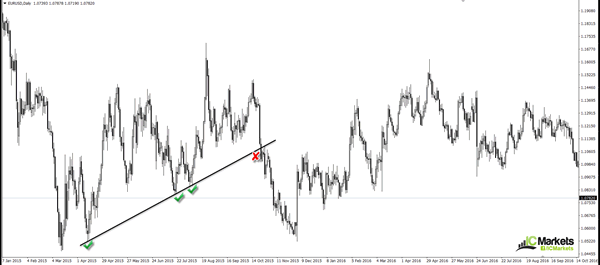
To draw an ascending trendline on a chart, at least two/three subsequent higher lows are required. To begin with we would recommend looking for an extreme low. An extreme low is where price has aggressively rallied and took out several highs along the way. This would be considered a good starting point. Check out the chart below. Using April’s low (2015) as an anchor point (the extreme low), and the mid-July low (2015) to form our line, we can see that price respected the trendline in August (2015). It was only once the EUR closed below this barrier in October 2015 did the market suggest that the bears may be gaining the upper hand.

Descending trendlines
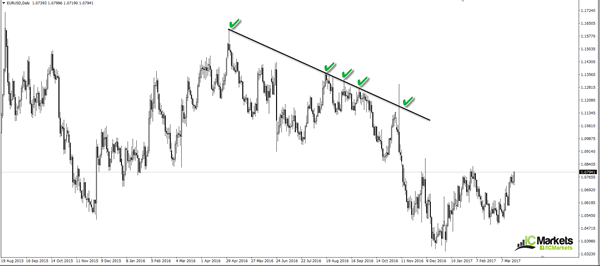
A descending trendline has a declining angle. Similar to the ascending trendline, we look for two/three subsequent lower highs as well as a reasonably extreme high to begin with. Looking at the chart below, we can see that the descending trendline is drawn from an extreme high point. The pair has respected this line numerous times and was aggressively whipsawed on November 8th 2016, which, if you remember, was the date of the US Presidential election. As of current price, it looks as though the unit will be crossing swords with this line again in the not so distant future.

Do we use the candle wicks/tails or the bodies to draw these lines?
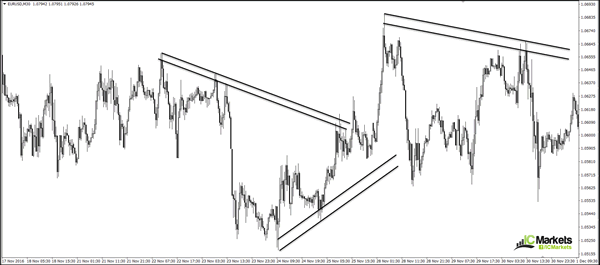
This is a question we see cropping up all the time. And the answer is simple: use both! Adopting both the candle extremes and the bodies allows market participants to pencil in a buffer, so to speak. On the chart below, we have plotted a few buffer zones to demonstrate this in action. In our humble opinion, traders should never consider a trendline to be a definitive line in the market. It should always be considered an area. And by drawing buffer zones, this helps accomplish this.

Once a trendline is broken
When a trendline is consumed, does it have any more use? Yes! Let’s say that a trendline support is taken out in the shape of a full-bodied bearish candle. If/when the market revisits this line, the base often provides resistance. You’ll be surprised how effective this technique is. In fact, remember the very first chart we looked at in the beginning of this article? This is a perfect example of this. The close below the trendline support was strong. Rather than continuing to plummet south, a few days following the break, price retested the underside of this base as resistance and then proceeded to clock fresh lows.
Additional points to consider
- The slope of a trendline determines the strength of the trend at hand.
- Check correlating markets to confirm the break of a trendline. For example, say that you witness price breach a H1 trendline resistance on the EUR/USD pair, and considering that the USD/CHF is a negatively correlated market to the EUR, we would expect to see a break of support on this pair, be it a trendline support, a demand zone or a support level.
- Is there a best timeframe to trade these lines on? The short answer is no. However, some technicians favour higher-timeframe structure over the lower timeframes as they feel it’s more reliable.
- While we do like trendlines, trading solely on the basis of this approach is not recommended. When these lines merge with other technical tools such as, support and resistance, psychological numbers and supply and demand, the probability of a reaction being seen increases dramatically. Remember, the more reasons there are to buy or sell, the more likely it’ll happen, hence why we absolutely love trading points of confluence!
