EUR/USD
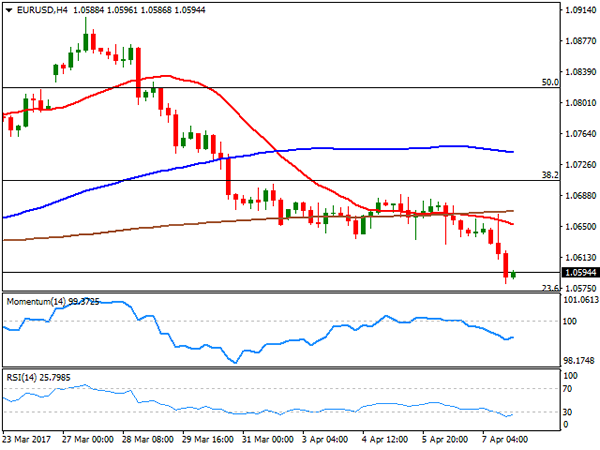
The EUR/USD pair broke below the 1.0600 level and reached a fresh 4-week low of 1.0580 in the US afternoon, with the greenback ending the week higher against most of its major rivals, with the exception of the Japanese yen. At the end of quite a choppy trading week, the American dollar gathered momentum, even despite the release of a soft US employment report. According to official numbers, the US economy added 98,000 new jobs in March, whilst February figure was downwardly revised from 235K to 219K. The unemployment rate fell to 4.5%, its lowest in near ten years from previous 4.7%. Wages rose by 0.2% in the month, while average hourly earnings up 2.7% on an annualized basis. The disappointment was quickly blamed to bad weather, and read as not enough to pushed the Fed away from its tightening path, favoring an already demanded greenback.
Risk aversion has also benefited the American currency during the first half of the day, after Trump launched a military strike on Syria early Asia, in response to the chemical attack from earlier this week, tautening its relationship with Russia. A terrorist attack in Stockholm fueled the negative sentiment, although a positive reaction of Wall Street to the Nonfarm Payroll report, offset the sour mood.
The EUR/USD pair is poised to extend its decline during the upcoming week, given that in the daily chart, it settled below its 100 DMA for the first time in over a month, whilst technical indicators head south within negative territory, also at fresh 1-month lows. Shorter term, the 4 hours chart shows that the price finally extended below its 20 and 200 SMAs, with the shortest gaining downward scope, whilst the RSI indicator maintains its strong downward slope near 23. The pair has quite a relevant support at 1.0565, the 23.6% retracement of the post-US election decline, with a break below it opening doors for a steeper decline afterwards, with the market then eyeing 1.0490, February monthly low.
Support levels: 1.0565 1.0525 1.0490
Resistance levels: 1.0620 1.0670 1.0710
USD/JPY
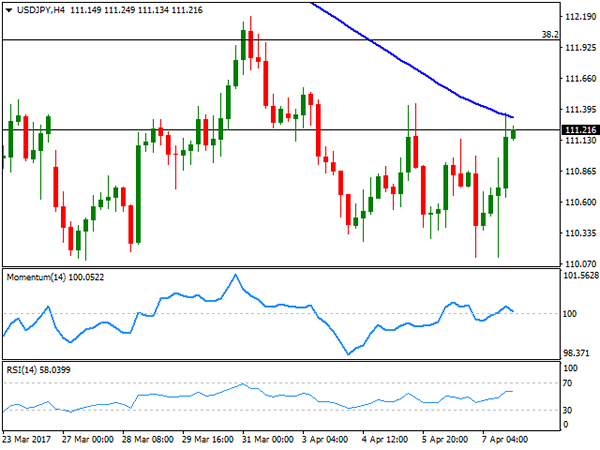
The USD/JPY pair closed the week pretty much flat around 111.20, recovering on Friday after testing 110.12 on the back of bouncing yields. US Treasury yields plunged immediately following the release of a soft US Nonfarm Payroll report to their lowest since last November, with the 10-year note benchmark tumbled to 2.29% before recovering to 2.37%. During the Asian session, news shown that Japan’s leading index dropped to a 3-month low in February, to 104.4 from 104.9 in January, although the coincident index, which reflects the current economic activity, came in at 115.5 in February, in line with expectations, up from 115.1 a month ago. The pair advanced late Friday as the dollar index regained the 101.00 threshold but settled below 111.60 a strong static support. Technically, the daily chart shows that the price is still well below a flat 100 DMA around 114.40, whilst technical indicators have recovered from oversold readings, but remain within negative territory, not enough to confirm further gains. Additionally, the pair stands below 112.00 the 38.2% retracement of late 2016 monthly run, and the level to surpass to consider a more constructive outlook.
Support levels: 110.95 110.50 110.10
Resistance levels: 111.60 112.00 112.50
GBP/USD
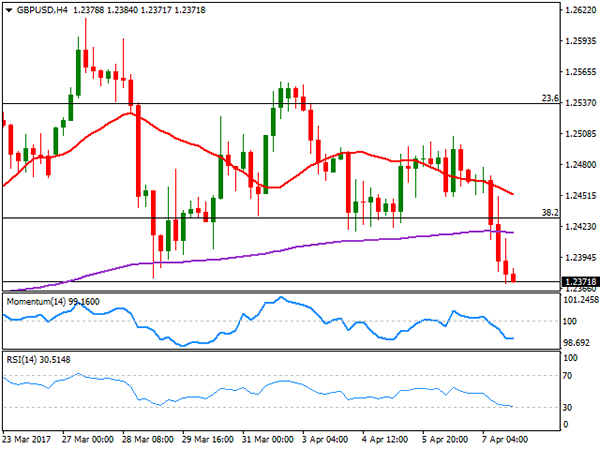
The GBP/USD pair closed the week sharply lower, settling a fresh 2-week low of 1.2370, as renewed dollar demand combined with poor UK macroeconomic data released last Friday. During February, manufacturing production fell by 0.1% monthly basis, ending up 3.3% when compared to a year earlier, while industrial production fell by 0.7% in the month, against expectations of a 0.2% advance. Also, the deficit on trade in goods and services widened to £3.7 billion in February from a revised deficit of £3.0 billion in January. Finally, the NIESR GDP estimate for the three months to March showed that the economy grew by 0.5% in the period, whilst the previous three-month figure was revised to 0.5% from 0.6%, overall indicating that the economy lost momentum by the end of the first quarter. Technical readings in the daily chart favor a bearish continuation for the upcoming days, as the price broke and accelerated below its 20 SMA, whilst technical indicators entered bearish territory, maintaining strong downward slopes. Shorter term, the 4 hours chart shows that the price extended below a bearish 20 SMA and the 200 EMA, whilst technical indicators maintain their bearish slopes near oversold territory, in line with the longer term outlook.
Support levels: 1.2330 1.2290 1.2250
Resistance levels: 1.2410 1.2450 1.2495
GOLD
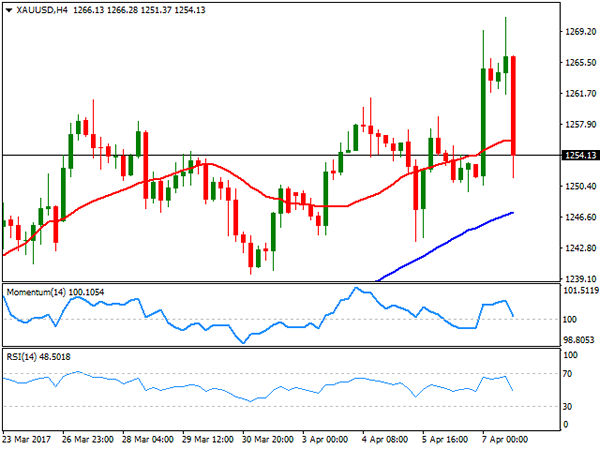
Gold surged to a fresh 2017 high of $1,270.94 a troy ounce, underpinned by risk aversion at the beginning of the day. The US strike on a Syrian airbase pushed investors into safe-haven assets, but sentiment flipped after the release of US employment data, tepid, but not enough to deviate Fed’s from the raising rates’ path, which resulted in a stronger USD and a recovery in US equities. The bright metal trimmed most of its daily and weekly gains, but managed to close marginally higher in both cases. From a technical point of view, the metal held above all of its moving averages, with the 20 DMA heading north around 1,246.20, whilst the Momentum indicator is aiming to bounce from its 100 level and the RSI indicator turned modestly higher around 60. In the 4 hours chart, the price settled below a bullish 20 SMA whilst technical indicators turned sharply lower and are crossing their mid-lines towards the downside, indicating that the commodity may extend its slide, particularly on a decline below the mentioned 1,246.20 level.
Support levels: 1,246.20 1,239.60 1,230.00
Resistance levels: 1,258.30 1,263.80 1,271.00
WTI CRUDE
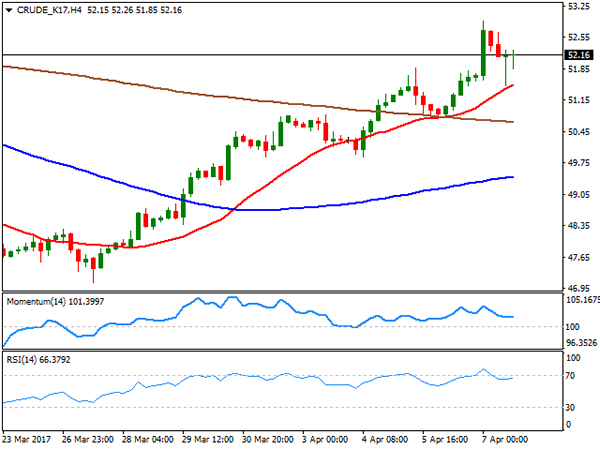
Crude oil prices rallied to fresh 1-month highs this Friday on news that the US fired missiles at a Syrian government air base, raising concerns over a possible output disruption in the oil-rich region. West Texas Intermediate futures traded as high as $52.92 a barrel, but eased from the level as the dollar strengthened in the US session, whilst the Baker Hughes report showed that the number of active rigs drilling oil in the world’s largest economy rose by twelfth consecutive week, up by 10 to 672. The black gold settled above 52.00, bullish according to technical readings, given that in the daily chart, it settled around its 100 DMA whilst the Momentum indicator stands flat well above its 100 level, but the RSI indicator keeps heading north around 64. In the 4 hours chart, an early decline was contained by a bullish 20 SMA, whilst technical indicators have lost directional strength, but hold within positive territory, all of which maintains the risk towards the upside.
Support levels: 51.30 50.80 50.30
Resistance levels: 52.20 52.90 53.6
DJIA
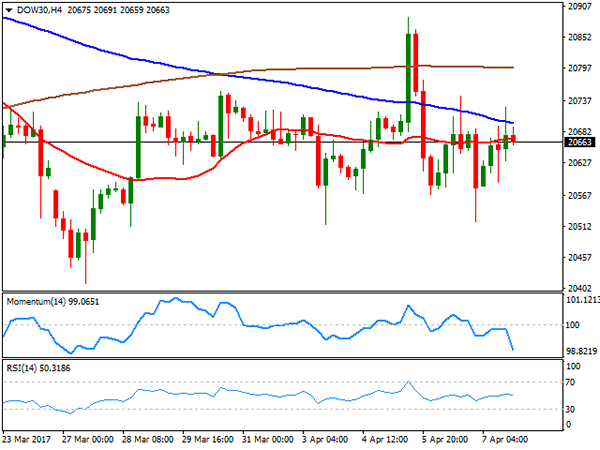
Wall Street closed flat on Friday, daily and weekly basis, with the DJIA down 6 points, to 20,655.96, and the Nasdaq Composite and the S&P shedding 1 point each, to end at 5,877.81 and 2,355.55 respectively. Stocks were unable to find direction, on hold at the beginning of the week amid pending first tier-data and trapped on Friday between risk aversion, and a stronger dollar, resilient to tepid employment figures. Most members were up within the Dow, with Wal-Mart leading advancers by gaining 2.10%, while El du Pont was the worst performer, ending the day 0.79% lower. The index heads into the next week with a neutral stance, as in the daily chart, it held right below a modestly bearish 20 DMA, whilst technical indicators remain stuck within their mid-lines, lacking directional strength. In the 4 hours chart, the index hovers around a flat 20 SMA but below a modestly bearish 100 SMA, whilst technical indicators head south within bearish territory, leaning the scale towards the downside.
Support levels: 20,616 20,562 20,515
Resistance levels: 20,720 20,754 20,790
FTSE 100
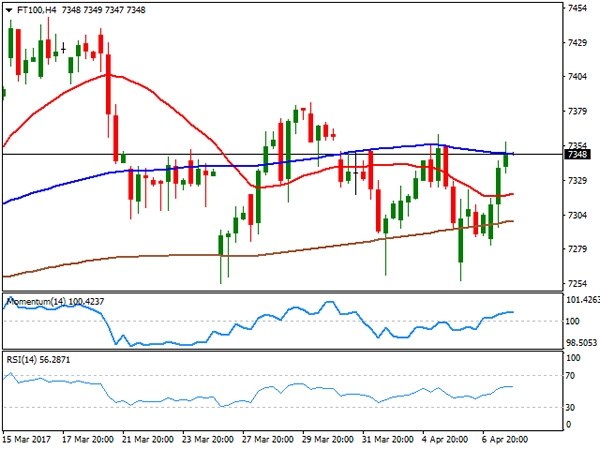
The FTSE 100 closed higher on Friday, adding 46 points or 0.63% and ending the week at 7,349.37, backed by a strong advance in defense stocks. Randgold Resources was the best performer, adding 4.29% on gold’s rally to fresh yearly highs amid ongoing risk aversion, followed by Standard Life, which added 3.63%. Financial and health care-related equities were the worst performers, with EasyJet leading losers’ list, down by 1.60%, followed by Lloyds Banking Group that lost 0.90%. The index ended the week pretty much flat, and with a limited upward potential according to the daily chart, as the advance was contained by a horizontal 20 SMA, whilst technical indicators turned modestly higher within negative territory, with not enough strength to confirm further advances. In the 4 hours chart, the benchmark maintains a neutral stance, contained between its 100 and 200 SMAs, and with technical indicators flat right above their mid-lines.
Support levels: 7,254 7,210 7,173
Resistance levels: 7,357 7,385 7,434
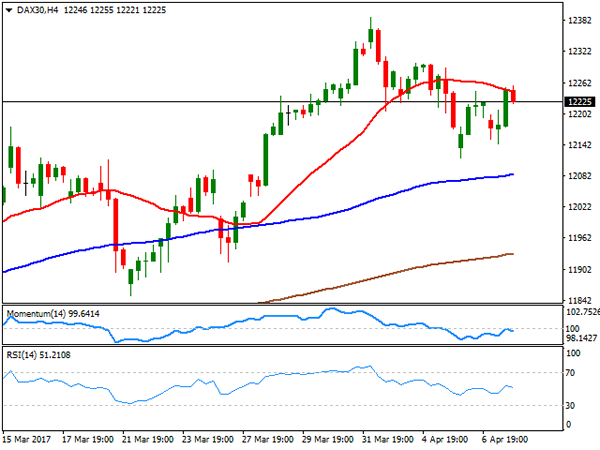
DAX
European indexes closed mixed on Friday, and not far from their daily openings, as a mixed US employment report offset early risk aversion. The German DAX closed at 12,225.06, down roughly by 6 points, helped by upbeat local data, as Industrial production rose 2.2% surpassing expectations of a slight contraction, whilst the trade balance printed a €19.9bn surplus on rising exports. Vonovia led advancers, adding 0.96%, followed by Heidelberg Cement that added 0.87%. Deutsche Lufthansa was the worst performer, ending down 2.53%, followed by Commerzbank that shed 0.87%. The index settled lower for the week after posting a fresh 2-year high, but overall the movement seems corrective, as the dominant bullish trend remains firm in place, given that in the daily chart, the benchmark is far above a strongly bullish 20 DMA, whilst the RSI indicator consolidates within neutral territory. In the 4 hours chart, however, the index remained contained by a bearish 20 SMA, whilst technical indicators retreated modestly after failing to overcome their mid-lines, indicating a probable downward correction ahead.
Support levels: 12,195 12,137 12,096
Resistance levels: 12,245 12,290 12,341