at 68 suggests ongoing bullish momentum, though nearing overbought territory indicates a possible correction. The Daily Moving Average Convergence Divergence (MACD) shows continued bullish momentum with rising green bars, though it might be peaking. Traders should note that while the pair's performance is strong, supported by its position above key SMAs, indicators point to potential corrections, with support around 202.00 and resistance near 203.00.)
During Monday’s session, the GBPJPY pair continued its uptrend, reaching a high of around 202.50, its highest level since 2007. Despite earlier attempts by sellers to push the pair down to 106.14, buyers regained control and drove the pair to new cycle highs. The Daily Relative Strength Index (RSI) at 68 suggests ongoing bullish momentum, though nearing overbought territory indicates a possible correction. The Daily Moving Average Convergence Divergence (MACD) shows continued bullish momentum with rising green bars, though it might be peaking. Traders should note that while the pair’s performance is strong, supported by its position above key SMAs, indicators point to potential corrections, with support around 202.00 and resistance near 203.00.
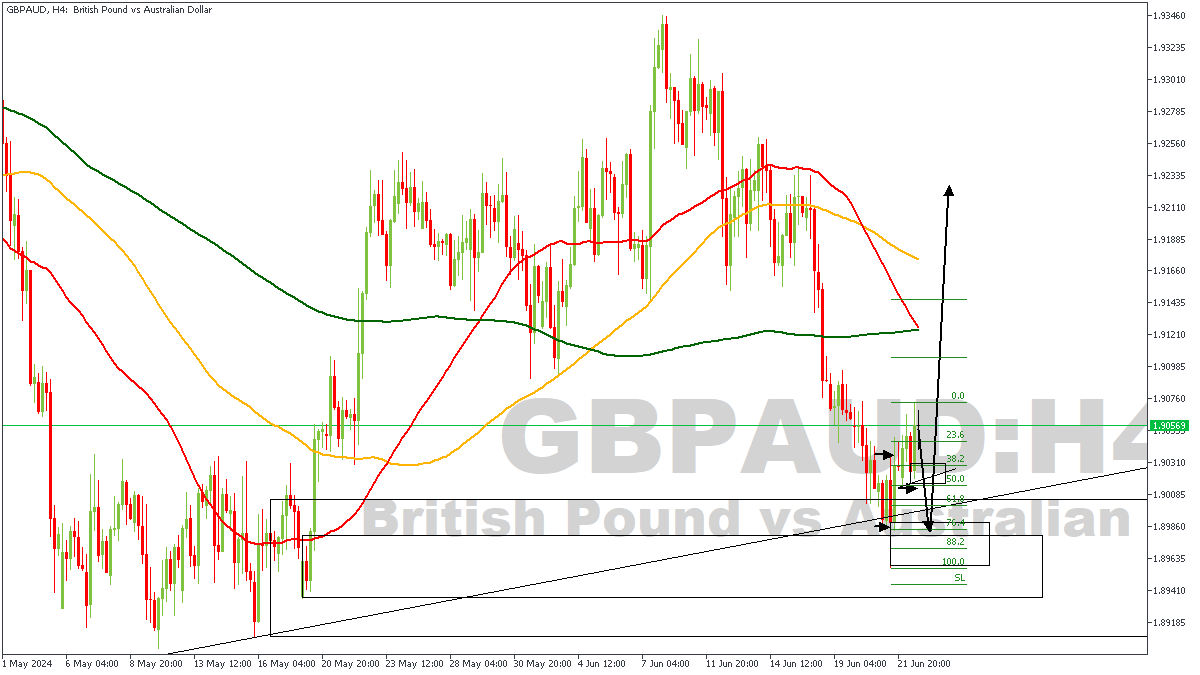
GBPAUD – H4 Timeframe
The far-left side of the attached chart shows evidently that a bullish break of structure occurred, pushing prices all the way to the high at 1.93440 before beginning a corrective move. However, at the moment, I expect price to bounce off the drop-base-rally demand zone I have highlighted on the chart, since the price action has even created a QMR pattern right in the middle of the demand zone. In the case of GBPAUD, my argument is bullish.
Analyst’s Expectations:
- Direction: Bullish
- Target: 1.91006
- Invalidation: 1.89556
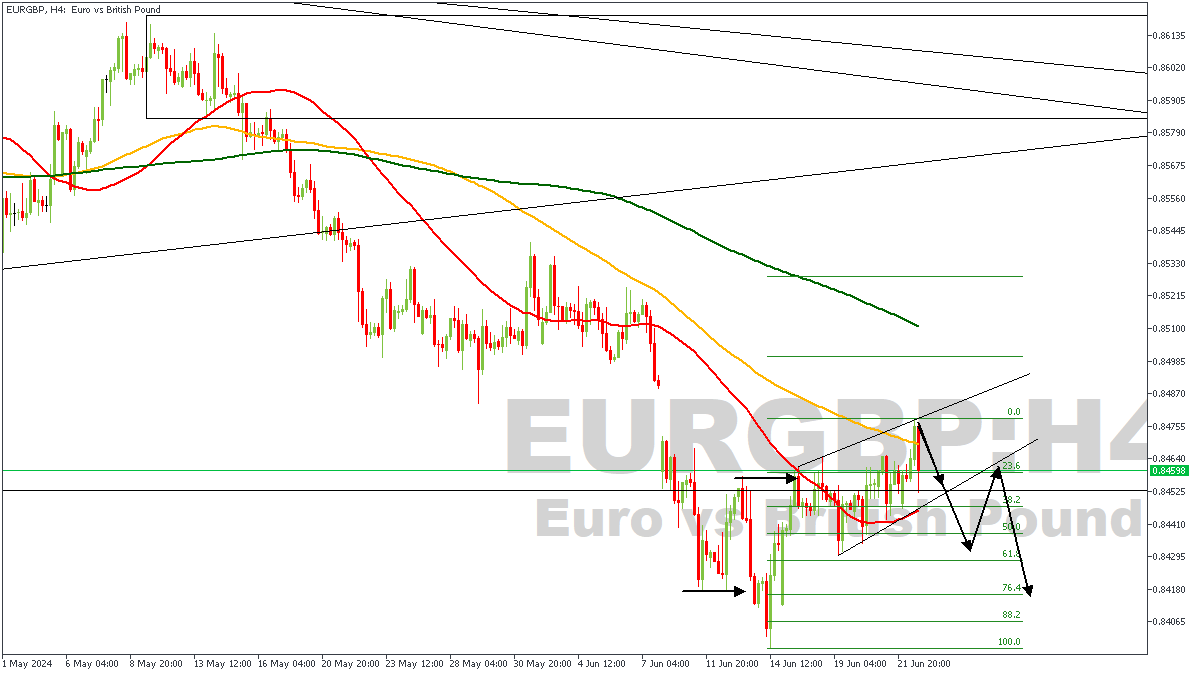
EURGBP – H4 Timeframe
EURGBP on the 4-timeframe chart shows an initial sweep of the sell-side liquidity from the highlighted arrowed line, and the break of structure that followed was also highlighted. According to LIT techniques (Liquidity Inducement Theorem), we ought to see price retrace low enough to sweep liquidity once again from the induced low. So, once price breaks below the trendline support of the ascending channel, my sentiment for a short entry would be validated.
Analyst’s Expectations:
- Direction: Bearish
- Target: 0.84279
- Invalidation: 0.84800
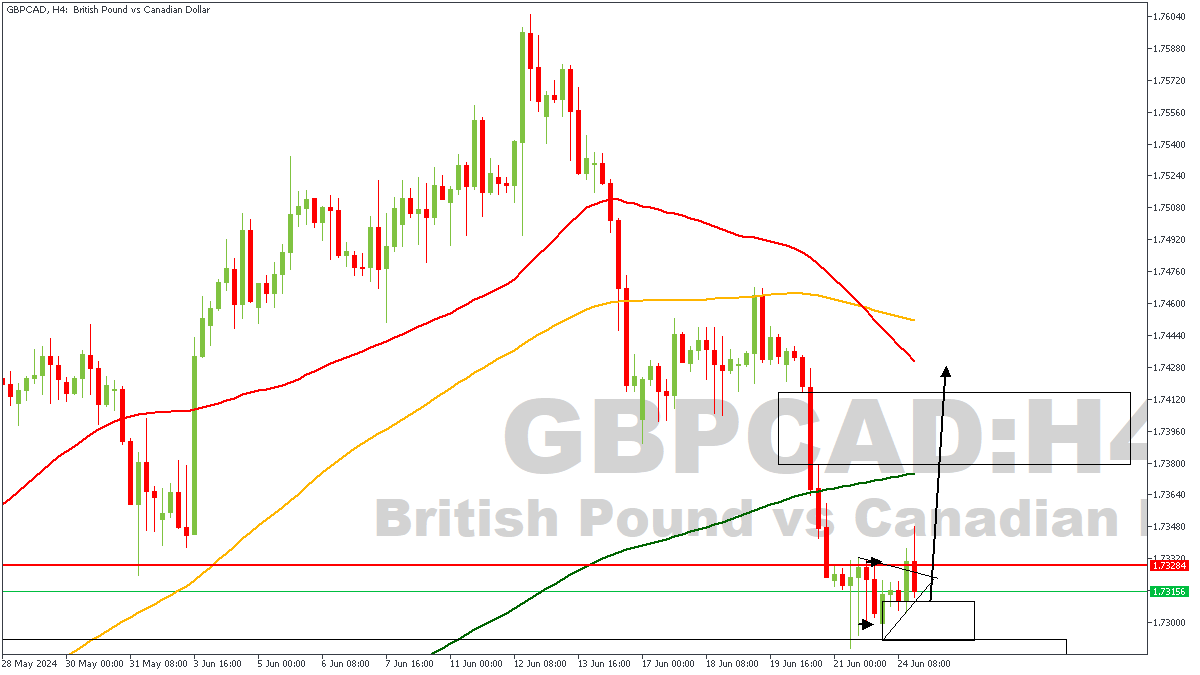
GBPCAD – H4 Timeframe
Within the GBPCAD daily timeframe pivot zone, we can see the attached chart showing a bullish breakout of a triangle pattern on the 4-hour timeframe, right within the demand zone. The implication of this is simply that we should begin to see increased bullish participation in the market since the bullish breakout often signifies that buyers are now in control of the markets.
Analyst’s Expectations:
- Direction: Bullish
- Target: 1.73685
- Invalidation: 1.72873