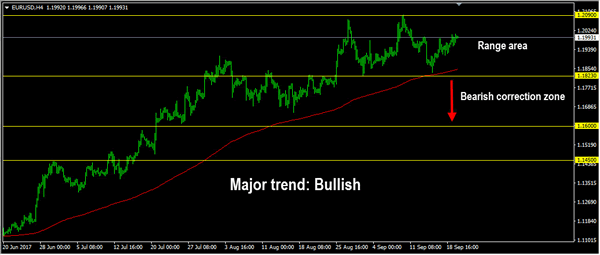
EURUSD
The EURUSD had a moderate bullish momentum yesterday topped at 1.2006. The bias is bullish in nearest term testing 1.2090 key resistance which need to be clearly broken to the upside to continue the bullish scenario targeting 1.2175 area. Immediate support is seen around 1.1950. A clear break below that area could lead price to neutral zone in nearest term but key support remains around 1.1823 area, which remains a good place to buy with a tight stop loss as a clear break below that area would take the pair to a bearish correction zone.
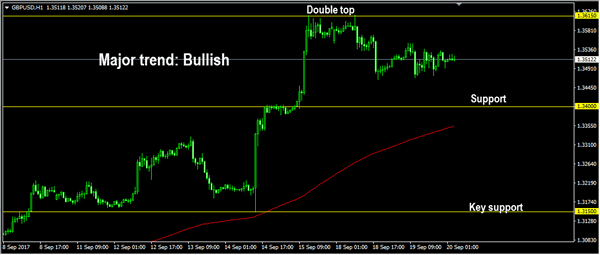
GBPUSD
The GBPUSD was indecisive yesterday. The bias is neutral in nearest term. Overall I remain bullish but price is still in a bearish correction/consolidation phase after formed a double top formation as you can see on my H1 chart below. Immediate support is seen around 1.3465 followed by 1.3400 region. Immediate resistance is seen around 1.3550. A clear break above that area could trigger further bullish pressure retesting 1.3615 key resistance which need to be clearly broken to the upside to continue the bullish scenario targeting 1.3700 – 1.3750 area.
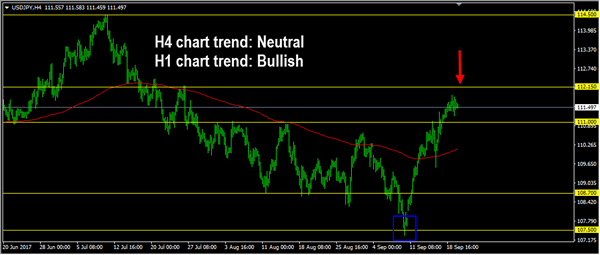
USDJPY
The USDJPY was indecisive yesterday. The bias is neutral in nearest term but overall price is still in a bullish phase since bounced-off 107.50 support area. Immediate support is seen around 111.00. A clear break below that area could trigger further bearish pressure testing 110.50 or lower. Immediate resistance is seen around 112.15. A clear break and daily close above that area could trigger further bullish pressure testing 113.10/50 area. Overall I remain neutral.
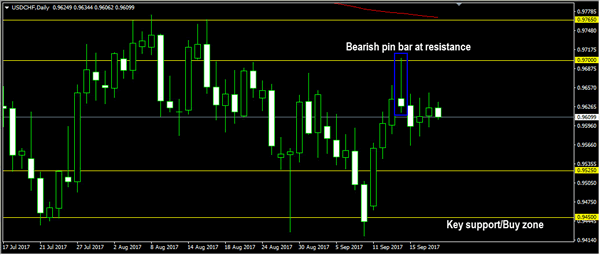
USDCHF
The USDCHF had another indecisive movement yesterday. There are no changes in my technical outlook. The bias remains neutral in nearest term probably with a little bearish bias testing 0.9565 – 0.9525 support area as a part of the bearish scenario after the appearance of the bearish pin bar on daily chart last week. Immediate resistance remains around 0.9650. A clear break and daily close above that area could trigger further bullish pressure testing 0.9700 region or higher. On the downside, a clear break and daily close below 0.9525 would expose 0.9450 key support which remains a good place to buy.