
A note on lower timeframe confirming price action…
Waiting for lower timeframe confirmation is our main tool to confirm strength within higher timeframe zones, and has really been the key to our trading success. It takes a little time to understand the subtle nuances, however, as each trade is never the same, but once you master the rhythm so to speak, you will be saved from countless unnecessary losing trades. The following is a list of what we look for:
- A break/retest of supply or demand dependent on which way you’re trading.
- A trendline break/retest.
- Buying/selling tails … essentially we look for a cluster of very obvious spikes off of lower timeframe support and resistance levels within the higher timeframe zone.
- Candlestick patterns. We tend to only stick with pin bars and engulfing bars as these have proven to be the most effective.
We typically search for lower-timeframe confirmation between the M15 and H1 timeframes, since most of our higher-timeframe areas begin with the H4. Stops are usually placed 1-3 pips beyond confirming structures.
EUR/USD
Weekly gain/loss: – 94 pips
Weekly closing price: 1.1940
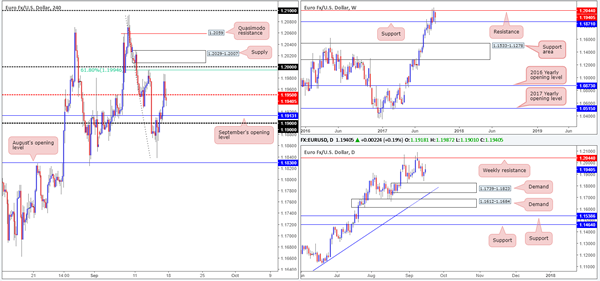
Over the past three weeks, upward momentum has somewhat diminished thanks to the weekly resistance pegged at 1.2044. Despite this, weekly bulls managed to chalk up a mild end-of-week correction last week from weekly support seen below at 1.1871, possibly encouraging buyers into the market. In addition to this, we can see that weekly price over on the USDX formed a nice-looking bearish pin bar off resistance at 11854, and shows room to move down to at least weekly support at 11687 (converges with a long-term weekly trendline support etched from the low 9322).
Since the 29th August, the daily candles have been consolidating between the noted weekly resistance level and a demand coming in at 1.1739-1.1823. Looking at the USDX daily timeframe, however, there’s a possibility that we may see further selling from resistance at 11868, as the next area of interest does not come into view until the 11681-11749 neighborhood (fuses with a channel support taken from the low 12352). As such, this could pressure the EUR up to the weekly barrier sometime this week.
A quick look at recent dealings on the H4 timeframe show US retail sales figures contracted on Friday, immediately forcing the pair higher. As you can probably see though (check the M30 chart), price quickly stalled following the move and began paring gains. Trade concluded with the piece closing below the H4 mid-level support logged at 1.1950.
Suggestions: For ease, let’s just recap what we have here:
Weekly price seen within moderate range – weekly USDX shows possible selling on the cards, which could force EUR higher.
Daily, at current price, is positioned mid-range with price likely heading higher to retest weekly resistance, thanks largely to USDX daily action pointing to the possibility of further selling.
H4 closed sub 1.1950. Next downside target located at September’s opening level drawn from 1.1913, followed closely by the 1.19 handle.
So, with the above in mind, our team has absolutely no interest in shorting sub 1.1950.
Although both weekly and daily price suggest buys, nevertheless, traders may want to note the large psychological number 0.80 lurking above. Not only is this a watched number, but it is also bolstered by a strong-looking H4 supply just above it at 1.2029-1.2007 and a nearby H4 61.8% Fib resistance at 1.1994 taken from the high 1.2092. For that reason, we have to be prepared for a possible bounce lower from here. Why we only expect a bounce should be obvious: the higher timeframes!
To trade any bounce seen from 0.80, we would highly recommend drilling down to the lower timeframes to secure a tighter entry (see the top of this report for information on how to do this). This will likely help with risk/reward should price reverse before reaching 1.1950.
Data points to consider: EUR Final CPI figures y/y at 10 am GMT+1.
Levels to watch/live orders:
- Buys: Flat (stop loss: N/A).
- Sells: 0.80 region ([waiting for a lower-timeframe entry signal to form is advised] stop loss: dependent on where one confirms this area).
GBP/USD:
Weekly gain/loss: + 395 pips
Weekly closing price: 1.3583
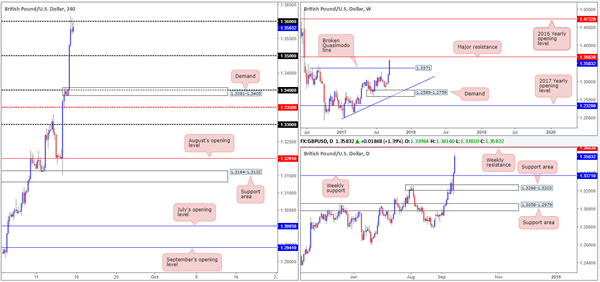
Cable printed another impressive weekly candle last week, consequently breaking through the weekly Quasimodo resistance level at 1.3371 and landing the unit within touching distance of a major resistance coming in at 1.3683 (seen as far back as 2001). With USDX weekly action printing a bearish pin bar last week from resistance at 11854, there’s a strong possibility GBP resistance will come into play this week. Looking down to the daily timeframe, there’s not really much to add except that the USDX daily candles show further selling could be seen down to demand at 11681-11749 (fuses with a channel support taken from the low 12352).
Reviewing Friday’s movement on the H4 timeframe reveals that the pound surged higher on Friday, after BoE policy maker Gertjan Vlieghe, a usual dove, signaled a shift in the BoE’s bias towards an interest-rate hike. The pair, after trading nearly 200 pips on the day, eventually found some refuge at the 1.36 handle going into the closing bell.
Suggestions: Though there are three beautiful-looking H4 selling wicks in view from 1.36, this would be a challenging sell. Aside from strong sentiment, price may want to push up to the aforesaid weekly resistance before any serious sellers begin making a play. As a result, the desk will be watching for 1.36 to give way. Should this occur and price retests the number as support, followed by a full, or near-full-bodied bull candle, we would look to long this market up to the 1.3680 neighborhood.
Data points to consider: No high-impacting events on the docket today.
Levels to watch/live orders:
- Buys: Watch for H4 price to engulf 1.36 and then look to trade any retest seen thereafter ([waiting for a H4 confirming bull candle to form following the retest is advised] stop loss: ideally beyond the candle’s tail).
- Sells: Flat (stop loss: N/A).
AUD/USD:
Weekly gain/loss: – 55 pips
Weekly closing price: 0.7999
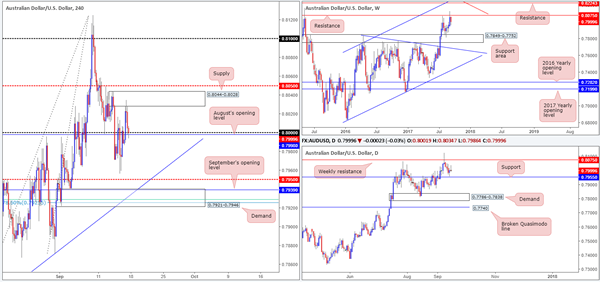
On the whole, the commodity currency remains entrenched within a relatively strong uptrend at the moment. However, weekly price does show bearish intent being seen from resistance penciled in at 0.8075, but whether it’ll be sufficient enough to half further buying is difficult to judge. Above the current resistance is another resistance level at 0.8224, seen converging with two trendline resistances (0.9757/0.7722).
Turning our attention to the daily candles, the pair is currently seen meandering between the noted weekly resistance and a support level drawn from 0.7955. A violation of this daily level would likely pressure the major back down to demand coming in at 0.7786-0.7838 (seen positioned within the walls of a weekly support area at 0.7849-0.7752 – the next downside target on the weekly scale).
During the course of Friday’s sessions H4 price reclaimed the large psychological level 0.80, following a somewhat decisive move lower from supply marked at 0.8044-0.8028. Aside from this being a widely watched number and converging with August’s opening level at 0.7998, this is not a level we expect price to reverse from. The team actually favors the 0.7950 neighborhood for longs due to the following points:
Daily support lodged at 0.7955.
Just below 0.7950 there is a strong-looking H4 demand base at 0.7921-0.7946.
Nearby September’s opening level at 0.7939.
61.8%78.6% H4 Fib supports at 0.7928/0.7925.
H4 trendline support etched from the low 0.7807.
Suggestions: Given that the H4 demand is located only a few pips below daily support, this would be an ideal area to buy, in our humble view. Not only would a move down to this area likely trigger stops from below daily support and the H4 mid-level support, it would also be a trade in line with the underlying trend and therefore could print a substantial move higher. Of course, the only grumble here is the current weekly resistance, but given the confluence bolstering a long, we feel a buy is worth the risk.
Data points to consider: No high-impacting events on the docket today.
Levels to watch/live orders:
- Buys: 0.7939 ([pending order] stop loss: 0.7918).
- Sells: Flat (stop loss: N/A).
USD/JPY:
Weekly gain/loss: + 300 pips
Weekly closing price: 110.83
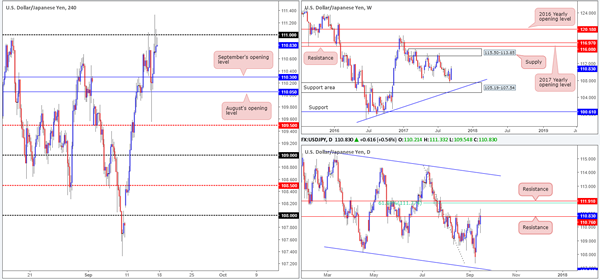
After clipping the top edge of a weekly support area at 105.19-107.54, USD/JPY bulls staged an aggressive recovery last week, completely engulfing the prior week’s losses. Although the USDX formed a bearish pin bar from weekly resistance at 11854 last week, the path north on the USD/JPY appears reasonably free up to as far as the weekly supply area punched in at 115.50-113.85.
Daily resistance at 110.76, as you can see, suffered a rather brutal blow on Friday as price struck highs of 111.32. While a marginal close was printed above this line, it is very difficult to judge whether this is enough to spark further buying on this scale up to resistance planted at 111.91/61.8% daily Fib resistance at 111.77.
A quick recap of Friday’s movement on the H4 timeframe shows price failed to sustain gains beyond the 111 handle, largely influenced by lower-than-expected US Retail sales. Although the move generated seller interest, there wasn’t much follow-through action seen. This was, as far as we can see, due to the US consumer sentiment index measured by Reuters/Michigan coming in a 95.3 against an expected reading of 95.1.
Suggestions: The H4 selling wicks chalked in around 111 have likely stirred candlestick traders – but we would advise treading carefully here! Both weekly and daily price suggest that further upside may be on the horizon. Therefore, we have absolutely no plans to sell this market anytime soon. In fact, similar to the GBP analysis above, we will be watching for the H4 candles to run above 111 and hold firm as support. Should this occur and price prints a full, or near-full-bodied bull candle following the retest, we would look to long this market up to the 111.80ish area (see daily resistances noted above).
Data points to consider: Japanese banks will be closed in observance of Respect-for-the-Aged Day. No US events on the docket today.
Levels to watch/live orders:
- Buys: Watch for H4 price to engulf 111 and then look to trade any retest seen thereafter ([waiting for a H4 confirming bull candle to form following the retest is advised] stop loss: ideally beyond the candle’s tail).
- Sells: Flat (stop loss: N/A).
USD/CAD:
Weekly gain/loss: + 40 pips
Weekly closing price: 1.2196
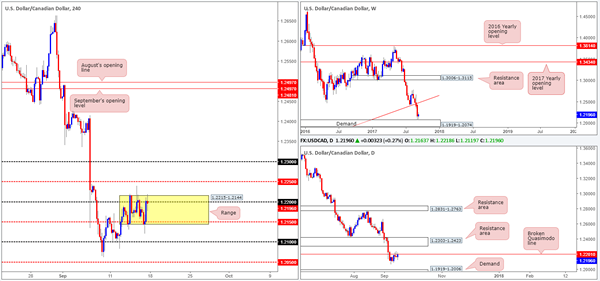
The USD/CAD closed marginally stronger last week after crossing paths with weekly demand fixed at 1.1919-1.2074. Why we have not seen a more explosive move transpire from here, at least from a technical standpoint, likely comes down to three things:
The strong downtrend that has been in play since the beginning of May. Notice price only managed to correct once over five months, and this only lasted two weeks!
There is also the fact that daily price is seen capped below a broken Quasimodo line at 1.2201. What’s more, a break above here will only free price up to nearby resistance area at 1.2303-1.2423.
Weakness seen from USDX weekly resistance at 11854 – notice last week’s selling wick and room to move lower.
Moving across to the H4 timeframe, we can see that the pair dipped to a fresh session low of 1.2119 on Friday following a disappointing US retail sales print. Price did, however, manage to recover relatively quickly, posturing itself back above the mid-level support 1.2150 and rallying to the 1.22 handle into the close. The other key thing to note here is the clear range that has been forming since the 13th September between 1.2215-1.2144 (yellow area).
Suggestions: On the account of weekly and daily structure, this is a somewhat difficult market to trade at this time. Yes, the overall trend is facing south, but we don’t want to become a seller when a weekly demand is in play!
Even with a decisive close above the current H4 consolidation, buyers then have to contend with potential offers from the H4 mid-level resistance 1.2250. It will only be once this line is cleared will the path north be clear up to the 1.23 neighborhood, which also happens to intersect with the underside of the aforementioned daily resistance area. So, intraday longs could be a possibility above 1.2250 up to 1.23. With that being said, nevertheless, do consider the risk/reward element here. Try to pin down a setup that’ll allow for at least two times your risk. If not, it might be worth passing.
Data points to consider: No high-impacting events on the docket today.
Levels to watch/live orders:
- Buys: Watch for H4 price to engulf 1.2250 and then look to trade any retest seen thereafter (stop loss: ideally beyond the rejection candle’s tail).
- Sells: Flat (stop loss: N/A).
USD/CHF:
Weekly gain/loss: + 152 pips
Weekly closing price: 0.9590
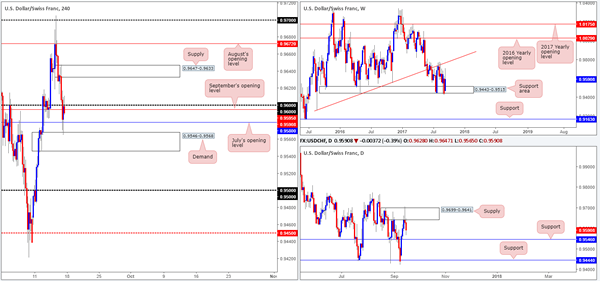
The weekly support area at 0.9443-0.9515, as you can see, remains in play. Irrespective of last week’s end-of-week correction, if the bulls push higher this week this could see the unit challenge a weekly trendline resistance extended from the low 0.9257. One other thing to keep in mind here though is weekly USDX price sold off from resistance at 11854 last week and printed a strong-looking selling wick.
Turning our attention to the daily timeframe, Thursday’s movement chalked up a nice-looking bearish selling wick around supply penciled in at 0.9699-0.9641, which encouraged further selling on Friday and placed price within striking distance of support at 0.9546. Also of particular interest is the daily USDX showing space to trade down to demand at 11681-11749 (fuses with a channel support taken from the low 12352).
Looking at Friday’s action on the H4 timeframe, price settled for the week just beneath the 0.96 handle, following a modest bid from demand pegged at 0.9546-0.9568 (sits on top of the daily support mentioned above at 0.9546). A sell from current price would be challenging not only because of the aforesaid demand, but also July’s opening level at 0.9580. A long above 0.96 on the other hand may be something to consider, but the move may only be good for 30 pips up to nearby supply at 0.9647-0.9633.
Suggestions: Personally, we do not see much to hang our hat on here at the moment, and as such, remaining on the sidelines may be the better route to take today.
Data points to consider: No high-impacting events on the docket today.
Levels to watch/live orders:
- Buys: Flat (stop loss: N/A).
- Sells: Flat (stop loss: N/A).
DOW 30:
Weekly gain/loss: + 448 points
Weekly closing price: 22256
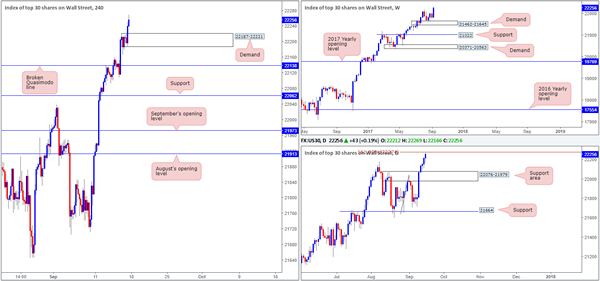
After price struck weekly demand at 21462-21645 five weeks ago, US equities eventually printed a fresh record high of 22256 last week. With absolutely no overhead resistance on the horizon, further buying could be seen this week. On the whole, traders have largely shrugged off latest North Korean tensions and the terrorist attack in London.
Down on the daily timeframe, nonetheless, we may see the index correct should price join with the 161.8% Fib ext. point at 22274 extended from the low 21645. On this scale, the next downside support target can be seen at 22076-21979.
In the event that price reverses from record highs today, the H4 demand zone at 22187-22221 will be the first port of call to keep an eye on. A violation of this area, however, likely opens the door for a test of the broken Quasimodo line at 22138, which happens to sit just above the noted daily support area.
Suggestions: As far as we’re concerned, this is a buyers’ market right now .Therefore, we’ll be watching both the above said H4 supports for possible buying opportunities today. To be on the safe side though, waiting for a H4 bull candle to form, preferably in the shape of a full, or near-full-bodied candle, before pulling the trigger may be best, since it is difficult to know which of the two areas will hold, if any at all.
Data points to consider: No high-impacting events on the docket today.
Levels to watch/live orders:
- Buys: 22187-22221 ([waiting for a reasonably sized H4 bullish candle to form – preferably a full, or near-full-bodied candle – is advised] stop loss: ideally beyond the candle’s tail). 22138 ([waiting for a reasonably sized H4 bullish candle to form – preferably a full, or near-full-bodied candle – is advised] stop loss: ideally beyond the candle’s tail).
- Sells: Flat (stop loss: N/A).
GOLD:
Weekly gain/loss: – $26.3
Weekly closing price: 1319.7
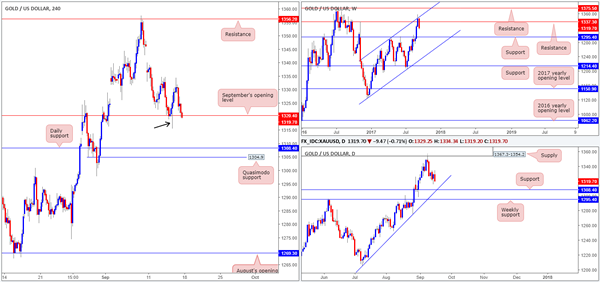
Following a rather decisive close above weekly resistance at 1337.3, which connected with a channel resistance extended from a high of 1295.4, the bulls generated little to no follow through last week. In fact, price erased all of the prior week’s losses and now looks poised to challenge nearby support coming in at 1295.4.
On the other side of the field, daily action closed the week out forming a near-full-bodied bearish candle, and has firmly positioned price just ahead of support coming in at 1308.4 (unites with a trendline support extended from the low 1205.0).
Across on the H4 timeframe, the unit ended the week marginally closing beyond September’s opening level at 1320.4. To our way of seeing things, the majority of buyers here are already likely consumed given the large consumption tail seen marked with a black arrow at 1315.4, thus the door down to the noted daily support is wide open, followed closely by a H4 Quasimodo support logged in at 1304.9.
Suggestions: Put simply, a short trade could be possible on any retest seen at September’s opening level today, targeting the daily support. Our only concern is that weekly USDX price shows price selling off from resistance at 11854 in the shape of selling wick. Therefore, it may be worth waiting for a H4 bearish candle to form following a retest of 1320.4, before committing to a trade.
Levels to watch/live orders:
- Buys: Flat (stop loss: N/A).
- Sells: 1320.4 region ([waiting for a reasonably sized H4 bearish candle to form – preferably a full, or near-full-bodied candle – is advised] stop loss: ideally beyond the candle’s wick).