HomeContributorsTechnical AnalysisElliott Wave View: CL_F Oil Pullback In Progress

Elliott Wave View: CL_F Oil Pullback In Progress

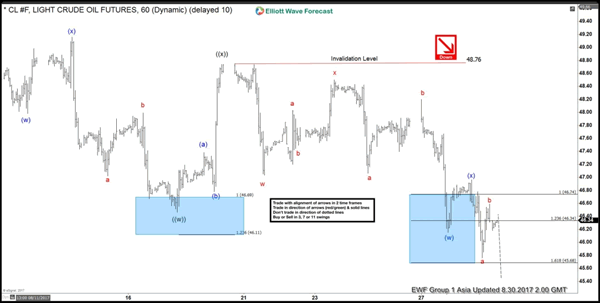
Oil Short Term Elliott Wave suggests that the decline from 8/1 peak is unfolding as a double three Elliott Wave Structure where Minute wave ((w)) ended at 46.46 and Minute wave ((x)) ended at 48.76. Oil has since made a new low below Minute wave ((w)) at 46.46 suggesting the next leg lower has started. Wave ((y)) is in progress and also subdivided as a double three where Minutte wave (w) ended at 46.15 and Minutte wave (x) is proposed complete at 46.96.

Near term, while bounces stay below Minute wave ((x)) at 48.76, Oil has scope to extend lower towards 43.92 – 44.85. This is an inflection area where Minute wave ((w)) = Minute wave ((y)) and buyers can appear in this area for at least a 3 waves bounce. We don’t like selling Oil and expect buyers to appear at 43.92 – 44.85 area (if reached) for at least a 3 waves bounce, provided that pivot at 6/21 low (42.07) remains intact.

Oil 1 Hour Elliott Wave Chart

Elliott Wave Forecast
Elliott Wave Forecasthttps://elliottwave-forecast.com
ElliottWave-Forecast has built its reputation on accurate technical analysis and a winning attitude. By successfully incorporating the Elliott Wave Theory with Market Correlation, Cycles, Proprietary Pivot System, we provide precise forecasts with up-to-date analysis for 52 instruments including Forex majors & crosses, Commodities and a number of Equity Indices from around the World. Our clients also have immediate access to our proprietary Actionable Trade Setups, Market Overview, 1 Hour, 4 Hour, Daily & Weekly Wave Counts. Weekend Webinar, Live Screen Sharing Sessions, Daily Technical Videos, Elliott Wave Setup videos, Educational Resources, and 24 Hour chat room where they are provided live updates and given answers to their questions.

Featured Analysis

Learn Forex Trading