EUR/USD
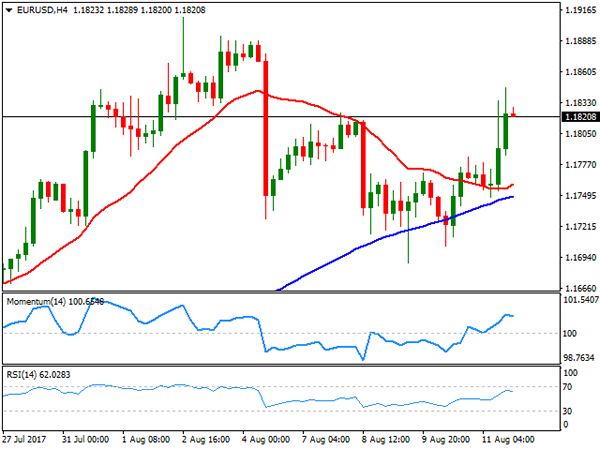
After a soft start to the week, the EUR/USD pair ended it up at 1.1820, a fifth consecutive weekly gain as soft US inflation coupled with arising political jitters. On Friday, official data showed that US CPI rose a seasonally adjusted 0.1% in July, and by 1.7% when compared to July 2016, missing market’s expectations. The core figures, those excluding volatile food and energy prices, were also below market’s forecasts, denting the case for a hawkish Fed next September, and even putting into question a move in December. Earlier on the week, risk aversion dominated markets, with North Korea and the US menacing the other with a nuclear attack, limiting gains for the high yielding common currency, but also harming the greenback.
The dollar has little hopes of changing course during the upcoming week, and in fact, for the next month, until the ECB and Fed’s monetary policy meetings next September. From a technical point of view, the downward potential is well-limited, given that in the daily chart, the price held above a bullish 20 SMA, despite a couple of attempts to break lower, while the Momentum indicator hovers within positive territory with a downward slope, but the RSI is already regaining the upside, currently at 65, somehow indicating further gains ahead. Shorter term, and according to the 4 hours chart, the upside is favored as the price settled above its 20 and 100 SMAs, while technical indicators hold within positive territory, easing the upward strength due to limited volumes at the end of the week, but far from suggesting a downward move ahead.
Support levels: 1.1780 1.1735 1.1690
Resistance levels: 1.1860 1.1910 1.1945
USD/JPY
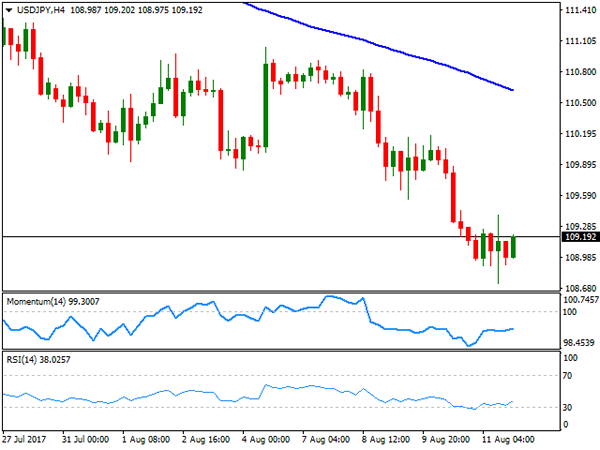
The USD/JPY pair fell down to 108.72 on Friday, its lowest since mid April, to end the day pretty much flat at 109.19, having, however, set a lower low and a lower high daily basis, in line with the dominant bearish trend. Risk aversion backed the yen’s rally, which appreciated alongside with government bonds, resulting in US Treasury yields falling to their lowest since late June. The 10-year note benchmark traded as low as 2.18%, to settle at 2.19%, while the 30-year note interest ended at 2.79%, unchanged for the day. Japan will release its Q2 preliminary GDP figures at the beginning of the week, with the economy expected to have grew by 0.6%, doubling Q1 0.3%. In the meantime, technical readings in the daily chart support a downward extension, as the Momentum indicator bounced modestly within bearish territory, whilst the RSI indicator consolidates around 31, and the price remains below its 100 and 200 SMAs. In the 4 hours chart, technical indicators have lost upward strength within negative territory and after correcting oversold conditions, whilst the price remains far below bearish moving averages. 108.80, June low, is the immediate support, with renewed selling pressure below it opening doors for a test of the year low at 108.12.
Support levels: 108.80 108.45 108.10
Resistance levels: 110.15 110.40 110.70
GBP/USD
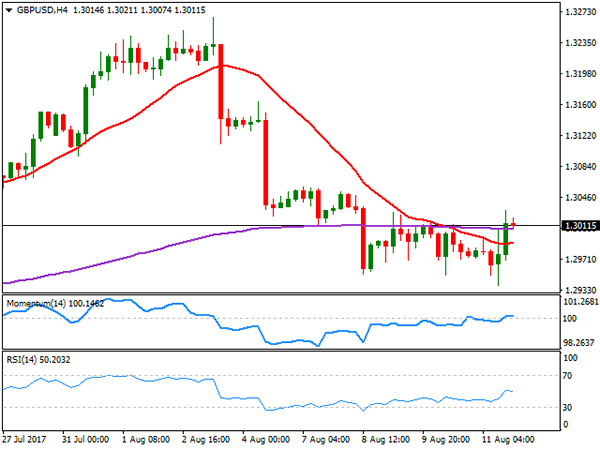
The GBP/USD pair closed at 1.3011, down for a second consecutive week, on poor demand for high-yielding assets amid dominating risk aversion, and a batch of disappointing UK data released on Thursday. Despite recovering on Friday due to dismal US inflation data, the Pound remains the weakest currency across the board after the USD, undermined by decreasing hopes of a BOE rate hike this year, and mounting uncertainty surrounding Brexit. This Tuesday will be key for the Pound, as the kingdom will release its July inflation figures at all levels, with CPI, PPI and the retail price index being out. Market’s expectations point for another flat reading monthly basis, but an uptick in yearly inflation, thus this last needs to be quite significant to bring a rate hike back to the table. The pair is poised to extend its decline according to the daily chart, as the pair remains below its 20 SMA, while technical indicators hold within negative territory, although with limited downward strength. In the 4 hours chart, the pair settled above its 20 SMA, and around the 200 EMA, while technical indicators lack directional strength within neutral territory, indicating a limited upward potential. The pair topped for the week at 1.3030, the immediate resistance, but it would take an advance beyond 1.3060 to revert, at least short-term, the negative stance.
Support levels: 1.2985 1.2950 1.2910
Resistance levels: 1.3030 1.3060 1.3095
GOLD
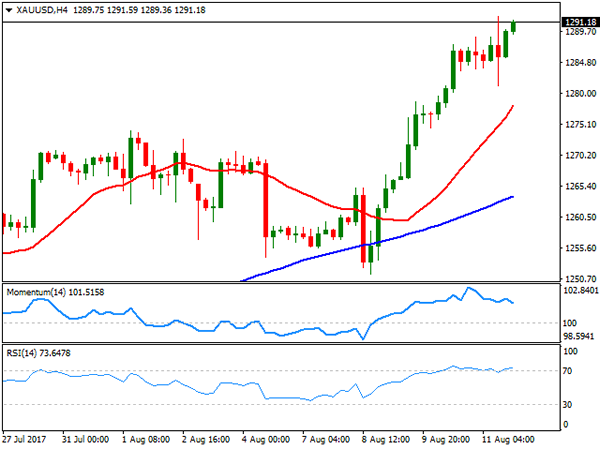
Spot gold settled at its highest in two months, ending Friday at $1,291.18 a troy ounce, boosted by the ongoing risk sentiment triggered by tensions between the US and North Korea. Base metals, particularly those considered safe-havens, benefited the most, as usual on times of fear, also helped by plummeting equities, and soft US inflation figures. By the end of the week, the US released its July PPI and CPI data, all of which came below expected, putting into question Fed’s ability to maintain its tightening pace. The rally may continue this week, as the macroeconomic background has little chances of changing. The daily chart shows that the price soared above all of its moving averages, with the 20 SMA accelerating north above its 100 SMA, the Momentum indicator easing within positive territory, and the RSI maintaining its bullish slope around 73. In the 4 hours chart, the Momentum indicator diverges lower, retreating from extreme overbought levels, but the price posts higher highs above all of its moving averages, whilst the RSI indicator remains firm above 70, suggesting that the commodity may extend its advance further, particularly on a break above 1,295.56, this year high.
Support levels: 1,283.60 1,274.10 1,266.20
Resistance levels: 1,295.60 1,303.10 1,311.80
WTI CRUDE OIL
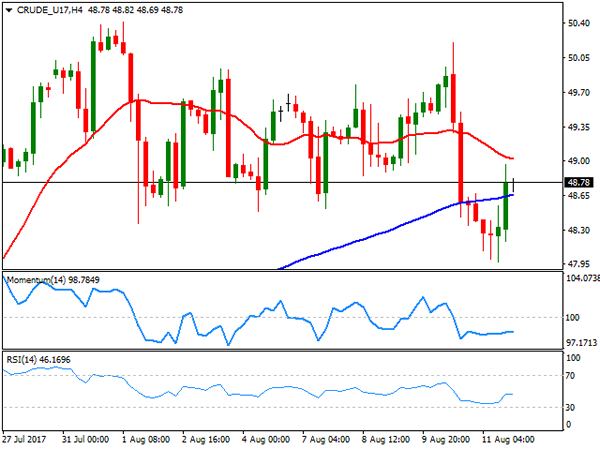
West Texas Intermediate crude oil prices fell down to 47.97 on Friday, recovering afterwards to end the day at $48.78 a barrel, anyway down for the week roughly 1.5%. News that the OPEC has increased its output during July, despite the late 2016 pact to reduce it, weighed on the commodity this past week, but signs that US production has stabilized let off some steam over the oil market. According to data released on Friday, the number of US active rigs drilling for oil climbed by three to 768 this past week, after rising by just one on the previous one. From a technical point of view, the daily chat shows that WTI established a few cents above its 20 DMA, but also that technical indicators have settled around their mid-lines, lacking directional strength. In the 4 hours chart, the price is below a bearish 20 SMA, while technical indicators stand pat within negative territory, limiting chances of a sharp recovery for the upcoming sessions.
Support levels: 48.50 47.90 47.20
Resistance levels: 49.65 50.20 50.70
DJIA
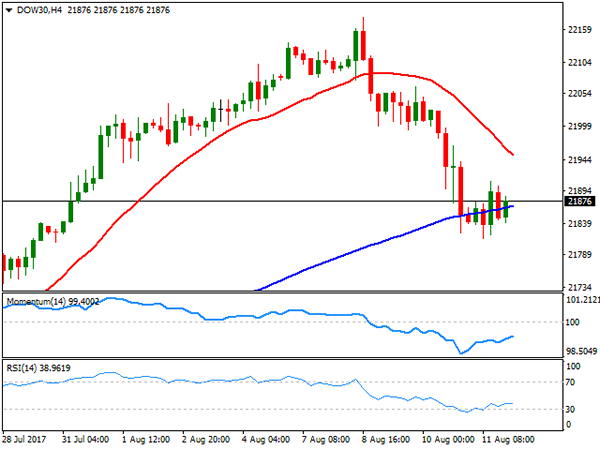
Wall Street managed to end Friday with modest gains, with the Dow Jones Industrial Average up 14 points, to end at 21,858.32, and the S&P adding 3 points, to 2,441.32. The Nasdaq Composite was the best performer, adding 39 points or 0.64%, to end at 6,256.56, as tech equities led the way higher. After falling on risk aversion for three consecutive days, US indexes recovered modestly during the last trading day of the week, as soft US inflation figures dented the case for another rate hike this year. Microsoft was the best performer within the Dow, up 1.53%, followed by Cisco Systems that added 1.52%. Travelers was the worst performer, down 1.16%, followed by Exxon Mobil that shed 0.96%. Down 1.1% on the week, the DJIA daily chart shows that the index settled around its 20 DMA, pressuring the indicator for a second consecutive day, while technical indicators retreated further from extreme overbought levels, but hold within positive territory. In the 4 hours chart, the index hovers around its 100 SMA, well below a strongly bearish 20 SMA and with technical indicators having bounced from oversold levels, but stabilizing within negative territory, maintaining the risk towards the downside.
Support levels: 21,843 21,808 21,760
Resistance levels: 21,909 21,941 21,992
FTSE100
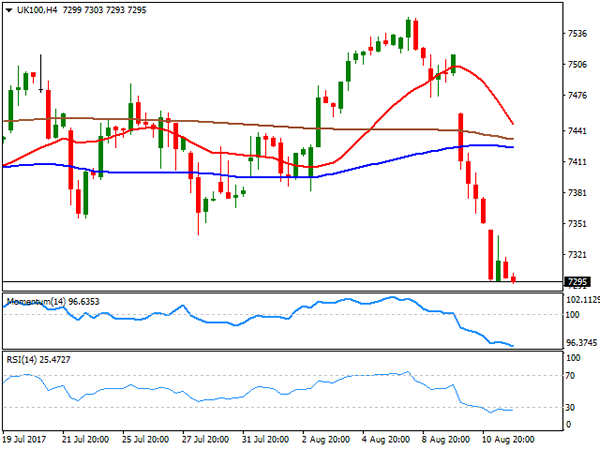
The FTSE 100 posted its lowest settlement in three months on Friday, down on the day 1.08% or 79 points, to 7,309.96. Mining-related equities led the way lower by the end of the week, hit by news coming from China, as the local Iron and Steel Association warned that rising prices were “not driven by market demand or reduced market supply” but speculative, adding that it may not be sustainable in time. Among advancers, Smurfit Kappa was the best performer, up by 1.74%, followed by Persimmon which added 1.58%. Standard Life on the other hand was the worst performer, down 3.75%, followed by Rio Tinto that shed 3.15%. The Footsie had its worst week in nearly four months, and the daily chart suggests that the slide may continue this week, as technical indicators continue heading south within negative territory, while the index settled far below its 20 and 100 DMAs. In the 4 hours chart the bearish momentum remains strong, as technical indicators maintain their downward potential within oversold territory, whilst the 20 SMA turned sharply lower far above the current level.
Support levels: 7,284 7,253 7,226
Resistance levels: 7,318 7,345 7,377
DAX
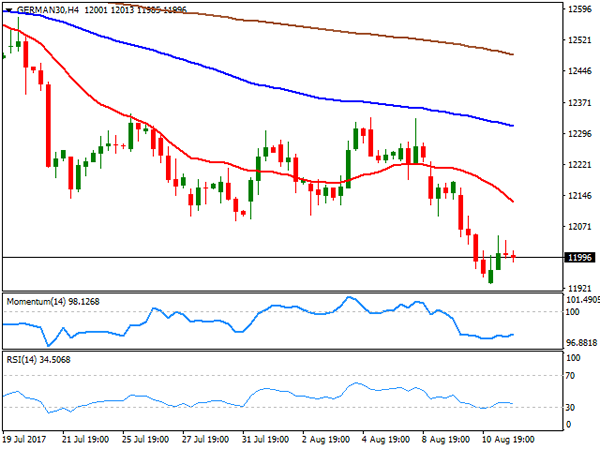
The German DAX managed to close unchanged on Friday at 12,014.06, although most European indexes closed lower, undermined by falling banks equities. The index closed the week deeply on the red as risk sentiment sent investors away from high yielding assets ever since the week started. Most members were up on Friday with Fresenius leading the way higher, up 1.83%, followed by Merck that added 1.79%. Commerzbank led decliners, down 0.94%, followed by Vonovia that lost 0.72%. The pair fell down to 11,933 by the end of the week, level last seen in March, and just a few points above a still bullish 200 DMA. In the same chart, however, the 20 DMA maintains a sharp bearish slope above the current level, while technical indicators hold within negative territory, in line with further slides ahead. In the 4 hours chart, the bearish tone is even stronger, with the 20 SMA accelerating south well above the current level, and technical indicators consolidating near oversold territory, with no signs of a possible recovery ahead.
Support levels: 11,985 11,933 11,874
Resistance levels: 12,048 12,097 12,146