EUR/USD
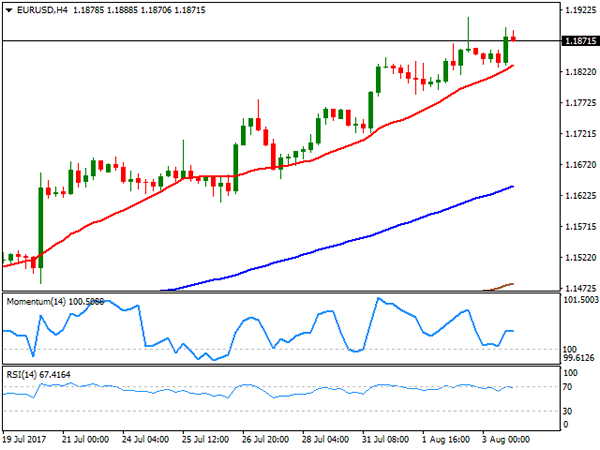
The EUR/USD pair recovered from a daily low of 1.1830 and settled at 1.1871, shrugging off early soft European data, and as investors still prefer to sell the greenback. Released at the beginning of the day, the EU final Markit July Services and Composite PMIs resulted below initial estimates and in line with the manufacturing readings released earlier this week. The German´s services sector advanced at its slowest pace since September 2016, resulting at 53.1 from 53.5, with the composite figure at 54.7 from 55.1. For the whole region, growth posted a six-month low according to Markit, with the composite index at 55.7 in July. Things in the US were not much better, as the official ISM non-manufacturing index fell more than anticipated, down to 53.9 in July, while the Markit figure was revised up to 54.7 from 54.2. Weekly unemployment claims for the week ended July 28th, were of 240K slightly better than a previously revised 245, but far from impressive.
Despite the little intraday volatility, the pair retains its bullish stance ahead of the NFP report, to be released early Friday, and seems unlikely that, even with a strong reading, the trend could change course, although a downward corrective move can’t be dismissed, particularly ahead of the weekend. Technically, the 4 hour chart shows that the price remains above a bullish 20 SMA currently around 1.1830, providing an immediate short term support, whist technical indicators hold well into positive territory, but with little directional strength, as the market entered wait-and-see mode ahead of the event. A really disappointing US employment report, could result in the pair ending the week near the 1.2000 threshold, while a slide down to 1.1715, August 2015 monthly high, will hardly affect the dominant bullish trend.
Support levels: 1.1830 1.1790 1.1750
Resistance levels: 1.1910 1.1950 1.1990
USD/JPY
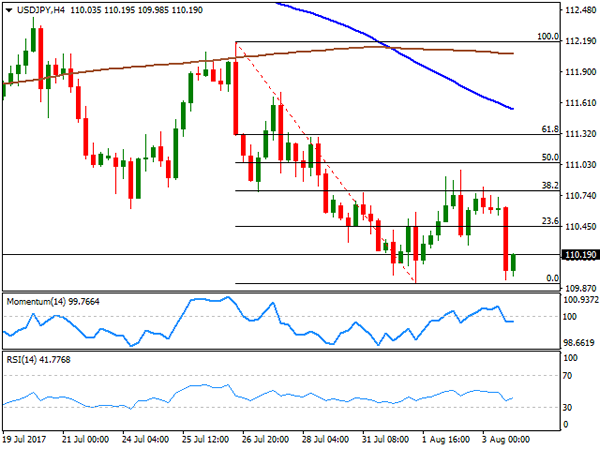
The USD/JPY pair fell down to 109.94 during the US session, but managed to bounce some, still ending the day in the red at 110.18. The decline started after the BOE’s monetary policy latest decision, as bond yields fell in the kingdom, dragging US ones lower, later fueled by a poor US ISM non-manufacturing index for July, which resulted at 53.9, well below previous 57.4 and the expected 57.0. The pair bounced after nearing its recent low and as investors were unwilling to push the pair before the 110.00 mark ahead of the key US employment report release this Friday. Trading at its lowest in near two-months, the pair is poised to extend its decline on a break below 109.90, the immediate static support, given that in the 4 hours chart, the price remains well below its 100 and 200 SMAs, with the shortest having accelerated below the largest, and with technical indicators holding within bearish territory. There’s a long way to the upside before calling a trend change, and seems unlikely that this would happen, even if US data surprise to the upside, as the pair would need to close the week at least above 112.40 to have an opportunity the next one.
Support levels: 109.90 109.40 108.80
Resistance levels: 110.35 110.80 111.20
GBP/USD
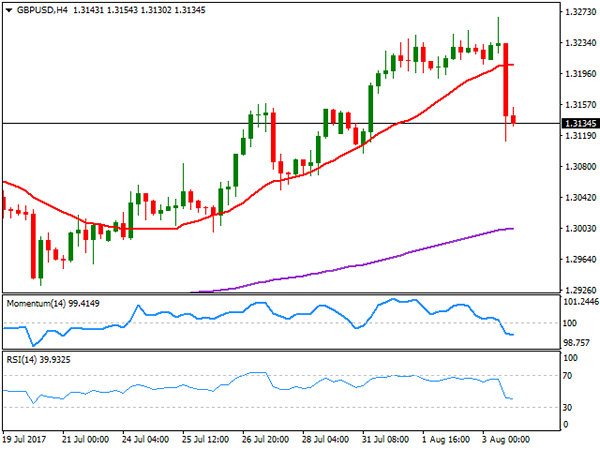
The GBP/USD pair was the star of the day, but for the wrong reasons, as it plunged to a fresh weekly low of 1.3111 following BOE’s monetary policy decision. The Sterling started the day with a strong footing, advancing to a fresh yearly high of 1.3266 against the greenback following the release of the latest UK services PMI that beat expectations at 53.8, but the BOE was a game changer. The Central Bank maintained rates unchanged at record lows of 0.25%, while two MPC members voted for a rate hike, in line with market’s expectations. Still the statement was tilted as dovish, a growth and wage growth forecast have been lowered, while inflation is now seen higher than within the previous projections, leaving a rate hike out of the table for now. Technically and for the short-term, the pair is now bearish as in the 4 hours chart, the price broke below its 20 SMA, now mostly flat above the current level, while technical indicators continue heading lower well below their mid-lines. Below the daily low, the pair will likely extend its slide, with the pair mostly seen ending the week near the 1.3000 figure.
Support levels: 1.3110 1.3075 1.3030
Resistance levels: 1.3150 1.3190 1.3225
GOLD
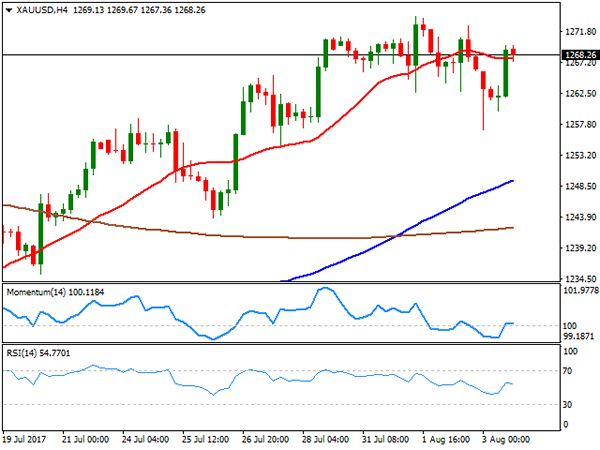
Spot gold plunged at the beginning of the session, later bouncing from a weekly low of 1,257.00 to settle at $1,268.25 a troy ounce. Demand for high yielding assets was behind the early decline, but as sentiment deteriorated though the day, the safe-haven commodity recovered its shine. Adding to the recovery were worse-than-expected US macroeconomic releases, which sent the greenback lower against most of its major rivals. Spot’s daily chart shows that the early decline reverted from near a still flat 100 DMA, whilst the 20 DMA accelerated its advance below the largest, and is about to cross it, usually a sign of trend continuation. The Momentum indicator in the mentioned chart keeps easing within positive territory, but the RSI remains firm around 65, limiting chances of a downward move. In the shorter term and according to the 4 hours chart, gold is now neutral, as the price is hovering around a horizontal 20 SMA, whilst technical indicators lack directional strength, now stuck around their mid-lines.
Support levels: 1,263.65 1,257.30 1,246.40
Resistance levels: 1,274.05 1,283.30 1,290.10
WTI CRUDE OIL
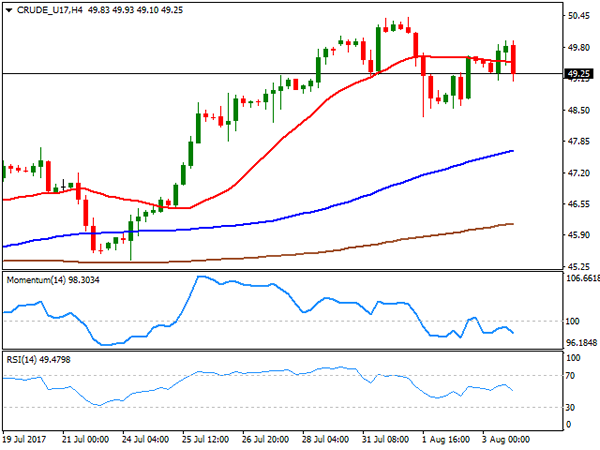
West Texas Intermediate crude futures retreated from an early advance towards 50.00 and closed the day in the red around $49.20 a barrel. Investor choose to take profits out after the US benchmark reached the key threshold, as oversupply concerns still weighed. According to a Reuters´ report, OPEC’s crude oil exports rose to a record highs in July, driven by soaring exports from the group’s African members, adding pressure on oil prices. Technically, the daily chart shows that the price was unable to advance beyond an anyway horizontal 200 DMA, while the 20 DMA kept advancing below the current level and it’s about to cross above the 100 DMA, both converging around 47.70. Technical indicators in the mentioned time frame keep retreating within positive territory, not enough to support a bearish extension, but limiting chances of a steeper recovery. Shorter term and according to the 4 hours chart, the commodity looks increasingly bearish, as it settled below a horizontal 20 SMA, while technical indicators turned south within negative territory after failing to surpass their mid-lines.
Support levels: 48.80 48.30 47.70
Resistance levels: 50.20 50.85 51.40
DJIA
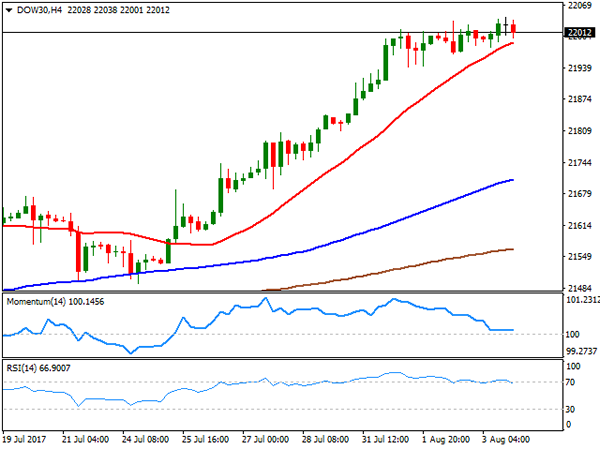
US major indexes closed mixed, although not far from their opening levels, with a retracement in the tech sector leading the way lower. Nevertheless, caution prevailed ahead of the release of the US monthly employment report, with the DJIA confined to a tight intraday range and ending higher by 9 points at 22,026.10 its seventh consecutive record close. The Nasdaq Composite settled 22 points lower at 6,340.34, while the S&P shed 5 points, or 0.22%, to 2.472.16. Pfizer was the best performer, adding 1.46%, followed by 3M which gained 1.00%. El du Pont led decliners, down 1.25%. From a technical point of view, the daily chart for the DJIA shows that the index held near its recent highs, maintaining the bullish stance as indicators continue heading higher within overbought levels, albeit with the RSI partially losing upward strength, whilst the index is further above its moving averages, despite the 20 DMA accelerated north. In the 4 hours chart, the technical picture is neutral-to-bullish, as the index held above a bullish 20 SMA, now the immediate support at 21,991, the RSI indicator remains flat around 71, while the Momentum corrected lower within positive territory, now bouncing modestly from its mid-line.
Support levels: 21,991 21,940 21,895
Resistance levels: 22,043 22,090 22,140
FTSE100
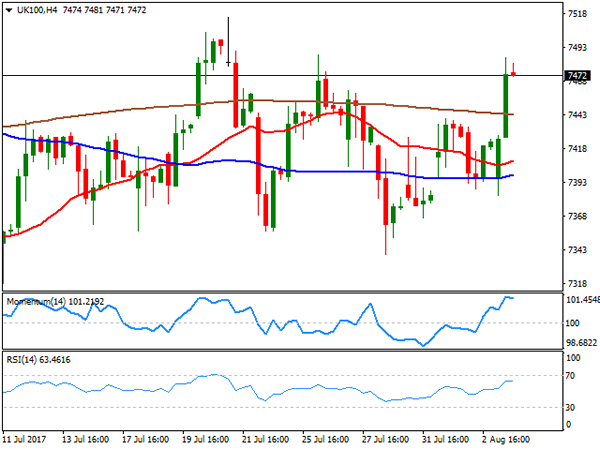
The FTSE 100 closed at 7,474.77, up 63 points on the day, as the Pound plunged following the BOE’s monetary policy decision, also backed by a recovery of mining-related equities. Next topped winners’ list adding 9.67% after raising the lower end of its full-year sales guidance, followed by Randgold Resources which added 3.43&. ConvaTec was the worst performer, down 6.38%, after the company’s first-half operating profit fell to $193.5 million from $209 million a year ago. The index advanced within its weekly range, paring gains right below Monday’s top of 7,515, with a modestly positive tone in its daily chart, as the index settled above its moving averages, with the 20 DMA gaining some bullish traction, as technical indicators bounced from their mid-lines, with limited upward strength. In the 4 hours chart, technical indicators are barely retreating from their daily highs, sill near overbought levels, whilst the index settled above all of its moving averages that anyway continue lacking directional strength.
Support levels: 7,440 7,392 7,340
Resistance levels: 7,485 7,520 7,551
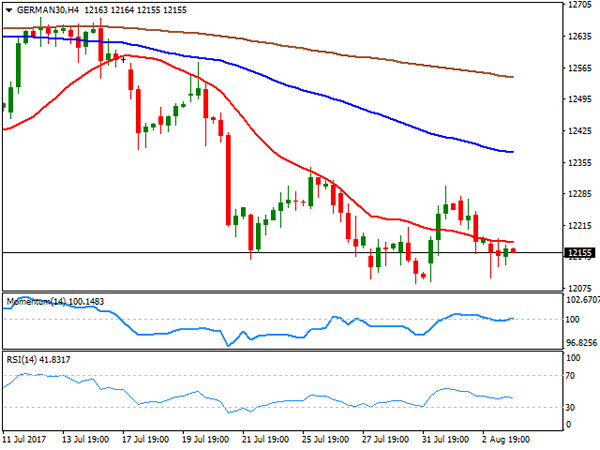
DAX
European equities closed mixed this Thursday, with the German DAX shedding 26 points or 0.22% to end at 12,154.72. Soft data released in Asia weighed on local shares, denting market’s sentiment in the following sessions. The banking sector was the best performer in Germany, with Commerzbank leading the way higher by adding 2.51%, while Deutsche Bank closed 0.56% higher. The technology sector changed course and fell, with Siemens leading decliners, down 2.98%, followed by Volkswagen which closed 1.09% lower. From a technical point of view, the daily chart shows that the index remained in the lower end of its weekly range, and at risk of falling further, as technical indicators keep heading south near oversold territory, whilst the 20 DMA has extended its advance above the current level and below the 100 DMA. In the 4 hours chart, the technical stance is neutral-to-bearish, as the index remained capped below its 20 SMA, whilst the Momentum indicator heads nowhere around its 100 level and the RSI indicator gains downward strength, currently around 41.
Support levels: 12,121 12,084 12,039
Resistance levels: 12,191 12,245 12,295