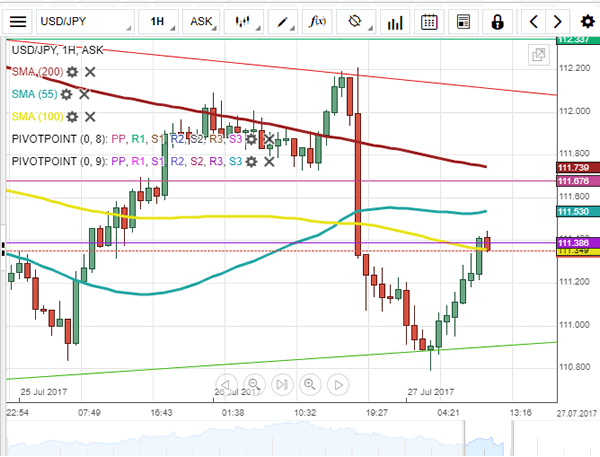
Thursday’s morning started relatively calm, as USD/JPY was driven by low volatility for most of the session. It met resistance at the 200-hour SMA which was eventually breached, thus allowing the US Dollar to approach the upper boundary of a symmetrical triangle. However, strong downside risks pressured the rate for a plunge down to the lower boundary of this pattern. The Greenback subsequently made a U-turn, demonstrating its willingness to edge higher once again. The closest resistance cluster is formed by the monthly PP and the 100-hour SMA circa 111.40, while the 20-, 55– and 200-hour SMAs are not distant either. In case nothing shakes the market unexpectedly, the pair is likely to push up to the 200-hour SMA where it may meet hindrance or even halt its upward motion. Bottom limit—110.50.

