EUR/USD
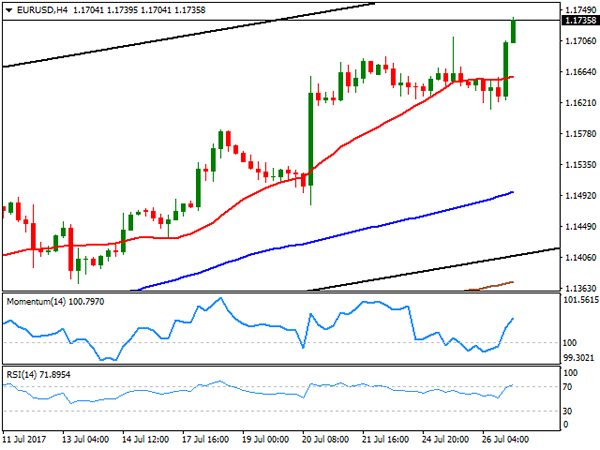
The EUR/USD pair traded uneventfully around the 1.1640 level, and after falling down to 1.1612, its lowest for the week, but resumed its advance breaking higher and settling at its highest since January 2015, in the 1.1730 region, following the US Federal Reserve monetary policy meeting. The Central Bank failed to surprise investors, keeping rates unchanged, as largely expected and barely changing the wording on the statement, particularly when it comes to reducing the $4.5 billion balance sheet, saying that it will start "relatively soon," and the market understanding it as September. As for inflation, policy makers still believe that it will “stabilize around the Committee’s 2% objective over the medium term," while the labor market has continued to strengthen. With no signs of accelerating its tightening pace, the market resumed dollar’s selling, with the greenback now trading near its recent multi-month lows against most of its major rivals.
As for the EUR/USD pair technical outlook, the price has regained ground above its 20 SMA in the 4 hours chart, whilst technical indicators turned sharply higher, maintaining their upward slopes within positive territory, and supporting further gains ahead on a break above the 1.1710 price zone, where the pair topped this week and back in 2015. Beyond the level, the rally could extend up to the 1.1800 price zone, where the pair has its 200 SMA in the weekly chart, and the top of the daily ascendant channel coming from mid-April with little in the way. A reversal in the ongoing bullish trend has become more unlikely, but intraday downward corrective movements can’t be disregarded. Still, the pair will remain bullish even in the case of a decline down to 1.1580.
Support levels: 1.1690 1.1650 1.1615
Resistance levels 1.1745 1.1790 1.1840
USD/JPY
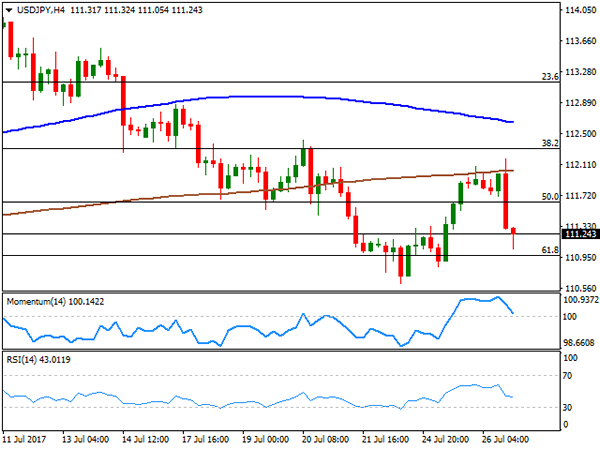
The USD/JPY pair fell down to 111.05, down after flirting with levels above 112.00 ahead of Fed’s statement. As the US Central Bank failed to surprise, market players resumed dollar’s selling, with Treasury yields coming back under pressure. By the end of the US session, the yield on the benchmark 10-year Treasury note slipped to 2.28% from previous 2.33%, while the yield on the 30-year Treasury bond was down to 2.90% from 2.91%. The Japanese calendar had little to offer on Wednesday, and will remain light this Thursday, which means that the pair will keep taking clues from yields and stocks. The decline is being limited by Wall Street’s gains, but the risk is clearly towards the downside, although an extension below 110.90 is required to confirm so. The 4 hours chart shows that the pair faltered around its 200 SMA, while the 100 SMA turned modestly lower above the largest, and technical indicators head sharply lower, with the RSI indicator already at 42, supporting the bearish case.
Support levels: 110.90 110.60 110.25
Resistance levels: 111.60 112.00 112.45
GBP/USD
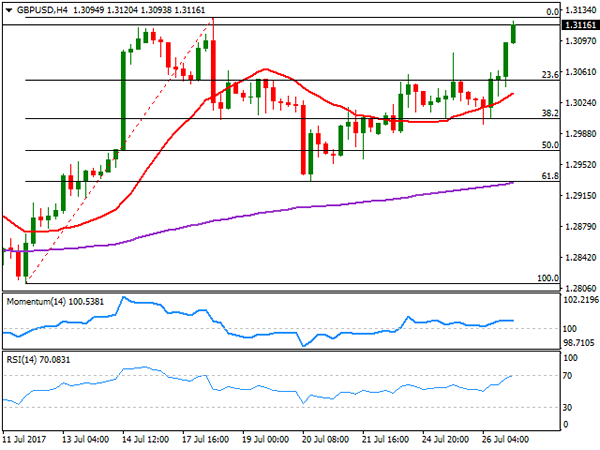
The GBP/USD pair settles above the 1.3100, its highest for the week, compliments to a neutral Fed monetary policy statement. The pair recovered from a daily low of 1.2998, achieved early London. UK data released this Wednesday failed to boost the Pound as the preliminary Q2 GDP figures were soft, as expected. The kingdom is estimated to have grew by 0.3% in the three months to June, with the annual rate resulting then at 1.7%. While the figures were in-line with market’s forecast, were also supportive of the current on-hold stance of the BOE, cooling further hopes for a rate hike in the UK. After the release, Finance Minister Hammond, said that while the UK can be proud of the continued growth seen over the past four years, they now need to focus on "restoring productivity growth to deliver higher wages and living standards for people across the country." Anyway, gains came as usual on the back of dollar’s broad weakness, with the pair now poised to challenge its yearly high, set this July at 1.3125. The 4 hours chart shows that the price has accelerated above a now bullish 20 SMA, whilst the RSI indicator advances around 69, although the Momentum indicator remains flat within positive territory, all of which supports some further gains ahead. A break above the mentioned yearly high exposes the 1.3180 price zone, where the pair has multiple daily highs and lows from August/September 2016.
Support levels: 1.3090 1.3050 1.3010
Resistance levels: 1.3125 1.3180 1.3230
GOLD
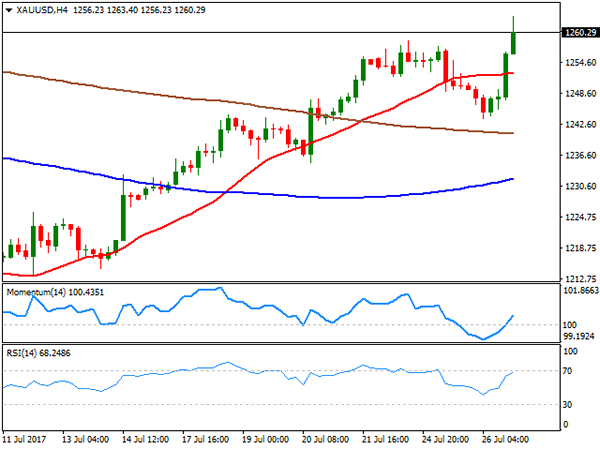
Gold prices rallied to settle at their highest in over a month, with spot ending the day at $1,266.20 a troy ounce after trading as high as 1,263.40. The commodity slipped at the beginning of the day amid a cautious stance among investors, and continued demand for high yielding assets, but turned north after the US Central Bank gave relief to dollar bears. Odds for another rate hike this year diminished after this meeting, now closer to 35%, backing the case for further gold gains. The commodity has regained the bullish stance after some consolidation earlier on the week, as the daily chart shows that the price settled above its 100 DMA, while technical indicators resumed their advances, and stand at fresh monthly highs with strong upward slopes. In the shorter term, and according to the 4 hours chart, the bright metal is also biased higher, as technical indicators re-entered positive territory, heading higher early Asian session, and with the price back above all of its moving averages.
Support levels: 1,258.80 1,245.20 1,236.30
Resistance levels: 1,266.60 1,274.10 1,283.30
WTI CRUDE OIL
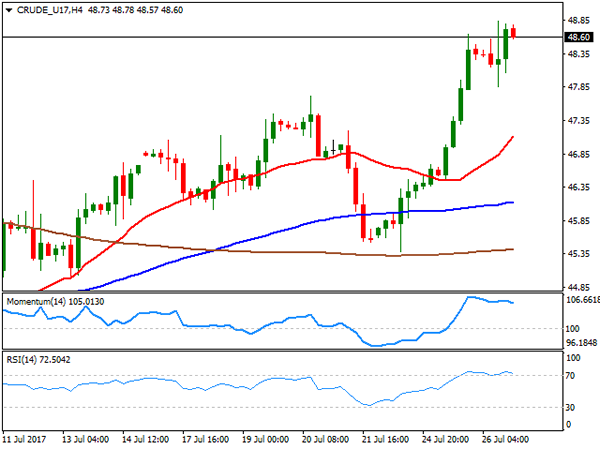
Crude oil prices extended their recent rallies on the back of fresh market news, with West Texas Intermediate futures up to $48.84 a barrel intraday, its highest since early June, after the EIA weekly report showed a surprise draw-down in US stocks. According to the report, domestic crude supplies fell by 7.2 million barrels for the week ended July 21, well beyond the 2.6 million barrels’ decline expected. WTI closed the day barely below that high at 48.60, maintaining the positive tone according to technical readings, as in the daily chart, the price bounced from its 100 DMA, now a strong dynamic support at 47.86, whilst technical indicators have lost upward strength near overbought levels, but are far from indicating a downward move ahead. In the 4 hours chart, technical indicators are currently consolidating within overbought readings, whilst the price stands far above all of its moving averages. Unless the market offers a negative surprise, WTI can extend up to the 50.00 level during the upcoming sessions, but gains beyond this last are still seen limited.
Support levels: 47.84 47.20 46.60
Resistance levels: 48.80 49.50 50.10
DJIA
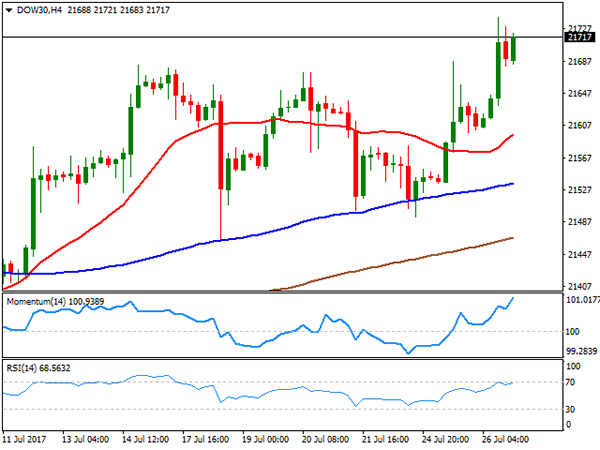
Wall Street had a stellar performance this Wednesday with the three major indexes closing at all-time highs. The Dow Jones Industrial Average added 97 points, and settled at 21,711.01, while the Nasdaq Composite gained 0.16%, to 6,442.75. The S&P was up barely 0.03%, to close at 2,477.83. US stocks rallied ahead of the opening, on the back of strong earnings, retreating ahead of the Fed, but resuming their advances afterwards. Boeing was the best performer within the Dow, up 9.91%, after reporting per-share earnings of $2.89, well above market’s consensus of $2.58. Nike led decliners with a 1.77% loss, followed by McDonald’s that shed 1.63%. The daily chart maintains the bullish stance seen on previous updates, with technical indicators extending their advances within positive territory and the benchmark further above bullish moving averages. In the 4 hours chart, the Momentum indicator heads north almost vertically within overbought territory, the RSI also aims higher around 66, whilst the 20 SMA gained upward strength far below the current level, supporting additional gains for this Thursday.
Support levels: 21,681 21,649 21,598
Resistance levels: 21,741 21,785 21,830
FTSE100
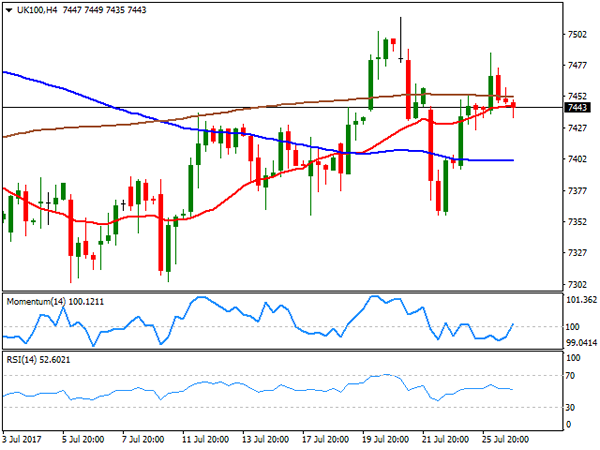
The Footsie closed the day in the green at 7,452.32, up 17 points, amid gains in the mining sector, also up after ITV raised its dividend saying its 16% fall in first-half pretax profit was in line with its expectations. The share led advancers with a 2.44% gain, while Anglo American added 2.01%. Paddy Power Betfair was the worst performer, ending the day down 2.95%, followed by Glaxo Smith that shed 2.55%. Pound’s strength after London’s close pressure the index in electronic trading, now around 7,440 and with the daily chart showing that it retains its positive tone, as it still stands above its 20 and 100 DMAs, both converging around 7,385, whilst the Momentum indicator continues heading higher above its 100 level. The RSI indicator in the mentioned time frame is, however, anticipating a probable bearish extension, having turned flat around 52. In the 4 hours chart, the index struggles around its 20 SMA and below the 200 SMA, while technical indicators lack directional strength, hovering around their mid-lines, and in line with the longer term view.
Support levels: 7,485 7,435 7,390
Resistance levels: 7,482 7,518 7,561
DAX
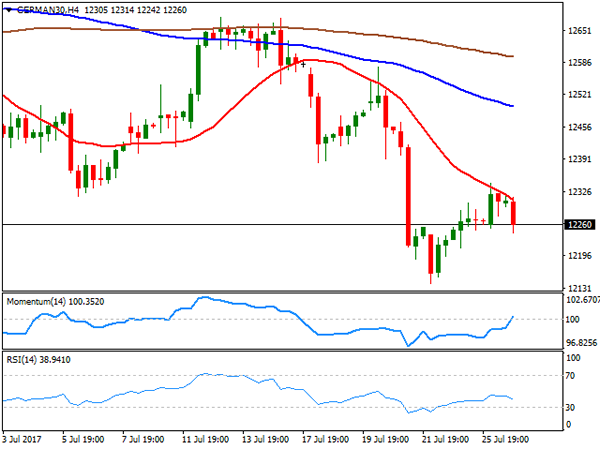
European equities closed higher this Wednesday, with the German DAX adding 41 points to 12,305.11, as banks remained buoyed, although the advance was moderate ahead of the Fed’s monetary policy meeting outcome. Within the German benchmark, Commerzbank was the best performer, adding 2.61%, followed by Volkswagen that gained 1.81%. On the negative side, Merck was the worst performer, ending the day 3.30% lower, followed by Daimler that shed 1.22%. The index fell in after-hours trading, following EUR soaring to fresh 2-year highs, now hovering around 12,260 and with the daily chart showing that the index remains below its 20 and 100 DMAs, with the shortest gaining downward strength around the largest, and ready to break higher, and technical indicators hovering within negative territory, with limited upward momentum, maintaining the risk towards the downside. In the 4 hours chart, a bearish 20 SMA capped the upside, while the Momentum aims higher around 100, but the RSI indicator turned south, currently around 39, supporting a bearish extension ahead.
Support levels: 12,234 12,190 12,153
Resistance levels: 12,303 12,354 12,398