
A note on lower timeframe confirming price action…
Waiting for lower timeframe confirmation is our main tool to confirm strength within higher timeframe zones, and has really been the key to our trading success. It takes a little time to understand the subtle nuances, however, as each trade is never the same, but once you master the rhythm so to speak, you will be saved from countless unnecessary losing trades. The following is a list of what we look for:
- A break/retest of supply or demand dependent on which way you’re trading.
- A trendline break/retest.
- Buying/selling tails … essentially we look for a cluster of very obvious spikes off of lower timeframe support and resistance levels within the higher timeframe zone.
- Candlestick patterns. We tend to only stick with pin bars and engulfing bars as these have proven to be the most effective.
We typically search for lower-timeframe confirmation between the M15 and H1 timeframes, since most of our higher-timeframe areas begin with the H4. Stops are usually placed 1-3 pips beyond confirming structures.
EUR/USD
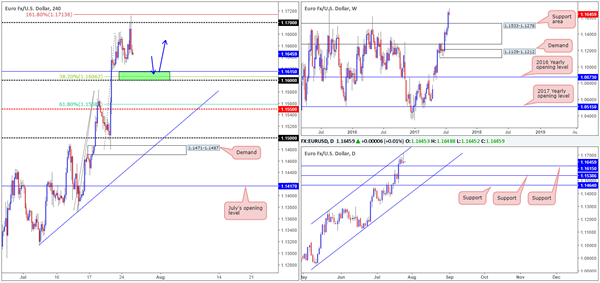
After momentarily surpassing the 1.17 handle on Tuesday and coming within an inch of clipping the underside of a H4 AB=CD 161.8% Fib extension at 1.1713 drawn from the low 1.1370, the single currency (influenced by a much higher-than-expected US consumer confidence report) turned aggressively lower.
What’s also notable from a technical perspective is that the daily candles recently connected with an upper channel resistance line extended from the high 1.1263, and chalked in a reasonably strong-looking daily selling wick.
While the above paints a somewhat bearish picture, there are two strong cautionary points to consider here:
Daily support at 1.1615 is hovering nearby current price.
Last week we saw a large weekly supply zone at 1.1533-1.1278 taken out, which had managed to stay intact since mid-May 2015! This suggests that overall the bulls are in control of things for the time being.
Our suggestions: Based on the above findings, our desk is watching the green H4 area marked at 1.16/1.1615 for potential long opportunities. The area is comprised of a psychological band at 1.16, a H4 38.2% Fib support level at 1.1606 pegged from the low 1.1479 and the daily support mentioned above at 1.1615.
To be on the safe side here, we’ve elected to wait for additional confirmation before pulling the trigger. Preferably, we want to see a full, or near-full-bodied H4 bull candle materialize from the said H4 buy zone. This, of course, will not promise a winning trade, but what it will do is display buyer intent from a high-probability reversal zone.
Data points to consider: US New home sales at 3pm, FOMC Statement and the Fed funds rate at 7pm GMT+1.
Levels to watch/live orders:
- Buys: 1.16/1.1615 ([waiting for a H4 bull candle to form before entering long is advised] stop loss: ideally beyond the candle’s tail).
- Sells: Flat (stop loss: N/A).
GBP/USD
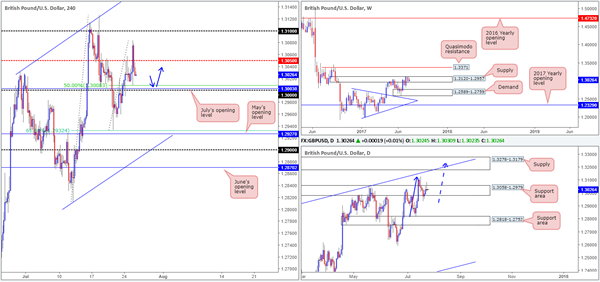
Kicking this morning’s report off with a look at the weekly chart, we can see that the candles remain within the walls of a supply zone pegged at 1.3120-1.2957. In the event that the bears finally regain consciousness here, the next downside target resides at 1.2589-1.2759: a demand base. On the other side of the field, however, the daily chart shows price action to be trading from a support area coming in at 1.3058-1.2979. What’s also interesting on this scale is the potential AB=CD bearish pattern that completes within the supply zone marked at 1.3278-1.3179 that converges with a channel resistance line drawn from the high1.2774.
Looking over to the H4 chart, recent action aggressively whipsawed through the mid-level resistance number at 1.3050 after a much higher-than-expected US consumer confidence report. As you can see, this has placed the candles within touching distance of the large psychological level 1.30, which happens to fuse nicely with July’s opening level at 1.3003 and a 50.0% support at 1.3008 taken from the low 1.2932.
Our suggestions: Given that the unit is positioned within a daily support area at the moment, and the weekly candles have yet to show much bearish intent within its current supply, we feel longs from the 1.30 region could be an option today in light of the surrounding confluence.
Like the EUR chart above though, we’ve elected to wait for additional confirmation before pulling the trigger from 1.30. Preferably, we want to see a full, or near-full-bodied H4 bull candle materialize from here. Should this trade come to fruition; the 1.3050 zone will be the first level on our radar for partial profit taking and a reduction in risk.
Data points to consider: UK Prelim GDP q/q at 9.30am. US New home sales at 3pm, FOMC Statement and the Fed funds rate at 7pm GMT+1.
Levels to watch/live orders:
- Buys: 1.30 region ([waiting for a H4 bull candle to form before entering long is advised] stop loss: ideally beyond the candle’s tail).
- Sells: Flat (stop loss: N/A).
AUD/USD
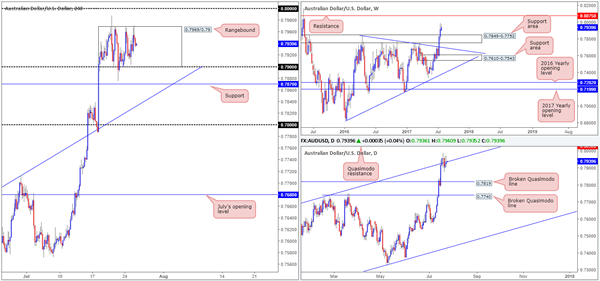
Since the 19th July, the H4 candles have been busy chiseling out a consolidation zone between 0.7969/0.79. A little above this area there is a large psychological band seen sitting at 0.80, whereas a few pips below is a support level marked at 0.7870.
Over on the bigger picture, the weekly resistance area at 0.7849-0.7752 was recently engulfed, potentially opening up the path north to a weekly resistance at 0.8075. Down on the daily timeframe on the other hand, the candles appear to be somewhat indecisive around a channel resistance line taken from the high 0.7732. Should this line eventually give way, the next area on the hit list is a Quasimodo resistance at 0.8030.
Our suggestions: Personally speaking, the current H4 range sparks little interest from us, due to there being no concrete higher-timeframe structure supporting the area. Nevertheless, we have noted the 0.80 level seen just above as a possible option for shorts, given its nearby connection to the daily Quasimodo resistance at 0.8030. Be that as it may, our desk would require additional confirmation before a sell from here would be considered, since there’s a good chance weekly price could step in a drag the unit up to 0.8075!
Data points to consider: Australian Inflation figures at 2.30am, RBA Gov. Lowe speaks at 4.05am. US New home sales at 3pm, FOMC Statement and the Fed funds rate at 7pm GMT+1.
Levels to watch/live orders:
- Buys: Flat (stop loss: N/A).
- Sells: 0.8030/0.80 ([waiting for a H4 bear candle to form before entering long is advised] stop loss: ideally beyond the candle’s wick).
USD/JPY
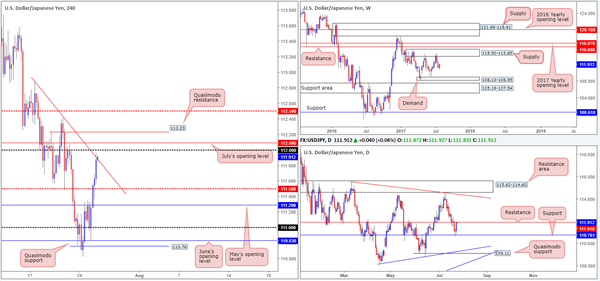
The USD/JPY bulls, as you can see, went on the offensive amid Tuesday’s segment, consequently lifting the pair above May’s opening level at 111.29 and a H4 mid-level resistance at 111.50. Intensified by a much higher-than-expected US consumer confidence report, the pair was able to end the day challenging a H4 trendline resistance taken from the high 112.87.
Weekly price is not currently offering much right now, other than that the candles are seen trading mid-range between supply at 115.50-113.85 and demand at 108.13-108.95. The daily chart, nonetheless, reveals that the unit is currently touching gloves with a resistance level coming in at 111.91, after a solid bounce seen from support at 110.76.
Our suggestions: Shorting from the current H4 trendline resistance is tempting, considering that it is linked closely with the aforementioned daily resistance. However, we’re a little cautious here. July’s opening level at 112.09 and the 112 handle are both located a few pips above the line, and therefore may act as a magnet to price and cause a fakeout. From this, you may be thinking, ‘well, why not just short 112.09/112?’ While the point is valid, one would still need to be prepared for this area to also be faked, due to a H4 Quasimodo resistance level lurking just above it at 112.23. Furthermore, by the time H4 price connects with this Quasimodo level, daily price may have already printed a close above the current resistance!
In light of the above notes, we’re going to humbly step aside today and reassess structure going into tomorrow’s segment.
Data points to consider: US New home sales at 3pm, FOMC Statement and the Fed funds rate at 7pm GMT+1.
Levels to watch/live orders:
- Buys: Flat (stop loss: N/A).
- Sells: Flat (stop loss: N/A).
USD/CAD
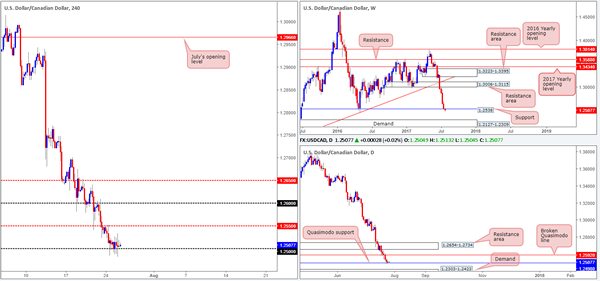
Tuesday’s session was incredibly quiet in the USD/CAD market. H4 price spent the day clinging to the 1.25 handle, printing several meaningless candles. This, as you can see by looking over to the daily chart, saw the market chalk up an indecision candle off of a Quasimodo support at 1.2506. Assuming that the bulls remain afloat above this level, we’d be looking for the market to retest 1.2592: a recently broken Quasimodo line. Up on the weekly chart, price recently came into contact with support at 1.2538. Although we have seen little evidence of bullish intent from here, it is far too early to count it out just yet!
Our suggestions: To confirm bullish strength in this market, we would like to see H4 price close above the mid-level resistance at 1.2550. This would, technically speaking, likely clear the runway north up to at least the 1.26 handle, which sits just above the aforementioned broken daily Quasimodo line.
Therefore, a H4 close above 1.2550 followed by a retest and a lower-timeframe confirming buy signal (see the top of this report) would, in our opinion, be enough to validate an intraday long up to at least the 1.26 region.
Data points to consider: US New home sales at 3pm, FOMC Statement and the Fed funds rate at 7pm. Crude oil inventories at 3.30pm GMT+1.
Levels to watch/live orders:
- Buys: Watch for H4 price to engulf 1.2550 and then look to trade any retest of this level seen thereafter ([waiting for lower-timeframe confirmation following the retest is advised] stop loss: depends on where one confirms this level).
- Sells: Flat (Stop loss: N/A).
USD/CHF
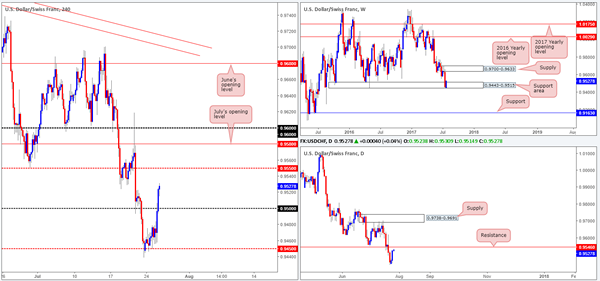
Influenced by a much higher-than-expected US consumer confidence report on Tuesday, the USD/CHF cleared the 0.95 handle and now looks poised to challenge the H4 mid-level resistance base at 0.9550. From a technical perspective 0.9550 is closely linked with a daily resistance level pegged at 0.9546. Although selling from the 0.9550 region seems reasonable, one has to remain cognizant of the weekly picture that currently shows price trading from a support area drawn in at 0.9443-0.9515.
As such, going short from 0.9550 would entail one selling into potential weekly flow! By the same token, buying would place one against both H4 and daily flow! Therefore, no matter which direction one chooses here, the odds are not really in your favor!
Our suggestions: In the absence of clearer price action, we have decided to remain flat during today’s trading and will look to reassess the situation going into tomorrow’s open.
Data points to consider: US New home sales at 3pm, FOMC Statement and the Fed funds rate at 7pm GMT+1.
Levels to watch/live orders:
- Buys: Flat (stop loss: N/A).
- Sells: Flat (stop loss: N/A).
DOW 30
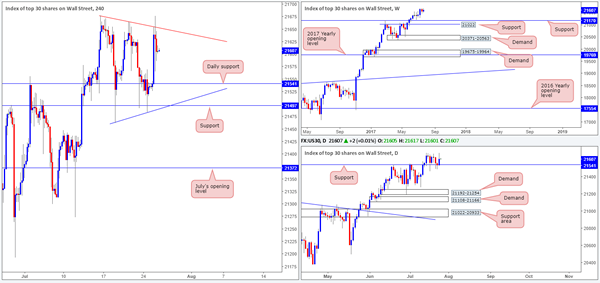
Over the past few weeks, we have been seeing the US equity market chalk up a potential H4 bullish pennant formation (21677/21462). This – coupled with seeing daily price bouncing off of a support level at 21541 and showing absolutely no resistance on the horizon, we feel that this pennant will eventually breakout to the upside. To us, this would be a valid buy signal, however not one that we would personally consider trading on the breakout.
To that end, as long as the daily candles remain above the noted support, our team will continue to favor the upside in this market.
Our suggestions: An ideal situation here would be to see a decisive H4 close above the current H4 pennant formation. Following this, a retest of the broken line in the shape of a full, or near-full-bodied H4 bull candle would be enough for us to enter into a long position with stops pegged below the H4 bull candle’s tail. This would, should it come to fruition, be an ideal time to try and join this seemingly undying trend!
Data points to consider: US New home sales at 3pm, FOMC Statement and the Fed funds rate at 7pm GMT+1.
Levels to watch/live orders:
- Buys: Watch for H4 price to engulf the current H4 pennant upper edge and then look to trade any retest seen thereafter ([waiting for a full, or near-full-bodied H4 bull candle to form following the retest is advised] stop loss: ideally beyond the candle’s tail).
- Sells: Flat (stop loss: N/A).
GOLD
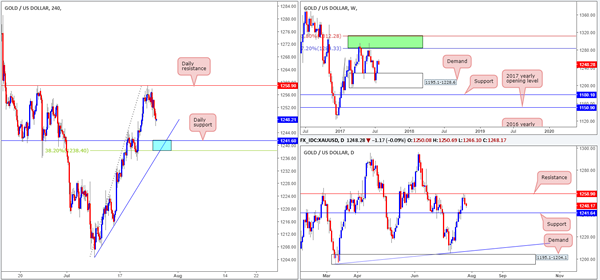
Since the yellow metal clipped the underside of a daily resistance at 1258.9, the unit has been trading in bearish territory and looks as though it will likely continue doing so until we reach daily support at 1242.0. Fusing closely with this level is a H4 trendline support etched from the low 1204.6 and a H4 38.2% Fib support also taken from the low 1204.6. Weekly price unfortunately offers very little support here as the candles are currently seen loitering mid-range between demand at 1195.1-1228.6 and an area comprised of two Fibonacci extensions 161.8/127.2% at 1312.2/1284.3 taken from the low 1188.1 (green zone).
Our suggestions: While we are seen trading from a daily resistance level at the moment, selling is difficult considering the noted H4/daily supports lurking nearby. In regard to buying, the H4 blue zone which is comprised of the above noted structures highlighted in bold is quite attractive for a bounce long today. With that being said, however, the area does lack weekly support, so in order to trade this area we would need to see additional confirming price action before pulling the trigger.
Levels to watch/live orders:
- Buys: 1238.4/1241.6 ([waiting for a reasonably sized H4 bull candle – preferably a full-bodied candle – to form before pulling the trigger is advised] stop loss: ideally beyond the candle’s tail).
- Sells: Flat (stop loss: N/A).