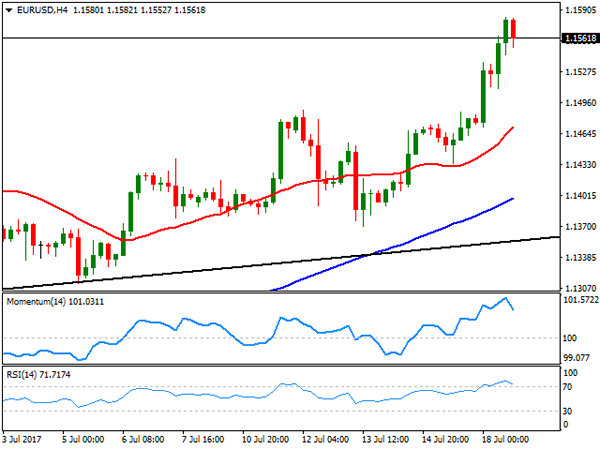
EUR/USD
The American dollar suffered from a major political setback late Monday that sent it nose-diving against all of its major rivals on Tuesday. The EUR/USD pair rallied up to 1.1582, the highest since May 2016, pulling back modestly ahead of the close, but settling anyway at its highest for the year. News that two GOP senators announced they won’t support moving forward with the Obamacare repeal bill, leaving the party without the majority enough to move the bill, sent an already weakened greenback tumbling, as seems the so long promised tax reform is far from being discussed this summer, when Trump can’t even get support with healthcare.
In the data front, Germany released its July ZEW sentiment survey, which showed that the economic outlook remains positive, although the index eased from the previous month. Business sentiment in the country came in at 17.5, down from previous 18.6, while the EU economic sentiment index resulted at 35.6 from previous 37.2. The US released some minor figures, but none of them relevant enough to affect the USD. Attention now flips to Thursday, when the ECB will have a monetary policy meeting. Despite expected to reduce is QE, the market believes that a formal announcement will come in September, but anyway will be looking for some hints this time.
From a technical point of view, the pair remains biased north, with scope to extend its advance in the short term up to 1.1615, May 2016 high. Intraday, the pair is extremely overbought more as a result of the bullish breakout of its latest range than amid continued gains over the last few sessions, leaving room for additional gains ahead. In the 4 hours chart, the price holds far above all of its moving averages, whilst technical indicators have turned lower, but remain within overbought territory, indicating limited selling interest around the pair.
Support levels: 1.1525 1.1490 1.1460
Resistance levels 1.1580 1.1615 1.1645
USD/JPY
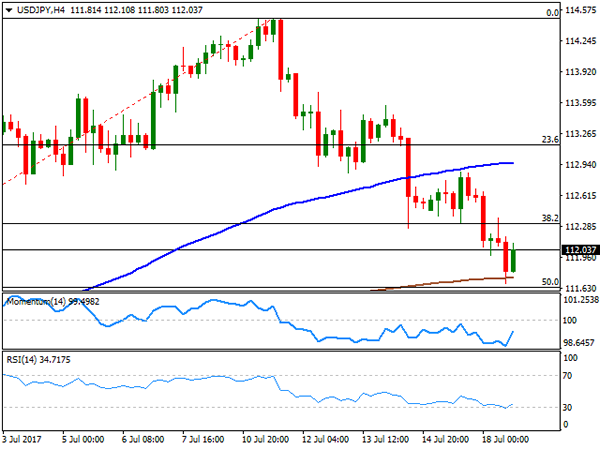
The USD/JPY pair fell down to 111.68, its lowest since June 30th, to end the day around 112.00. The soft tone of European equities and a slide in US Treasury yields backed the rally of the Asian currency, in the absence of local data, with the Japanese calendar empty until next Thursday, when the Bank of Japan will have an economic policy meeting and the country will release its trade balance figures. The US 10-year note benchmark fell down to 2.27%, while the 2-year note interest eased to 1.35%. Technically, the pair managed to bounce on an approach to the 50% retracement of its latest bullish run at 111.60, the immediate support, but technical readings support additional slides ahead, given that in the 4 hours chart, the pair settled well below its 100 SMA and barely above the 200 SMA, whilst technical indicators have bounced modestly from oversold readings, but remain within negative territory. A break below the mentioned Fibonacci support, the pair has scope to extend its slide towards 110.90, where the pair presents multiple intraday lows from last June.
Support levels: 111.60 111.20 110.90
Resistance levels: 112.30 112.70 113.10
GBP/USD
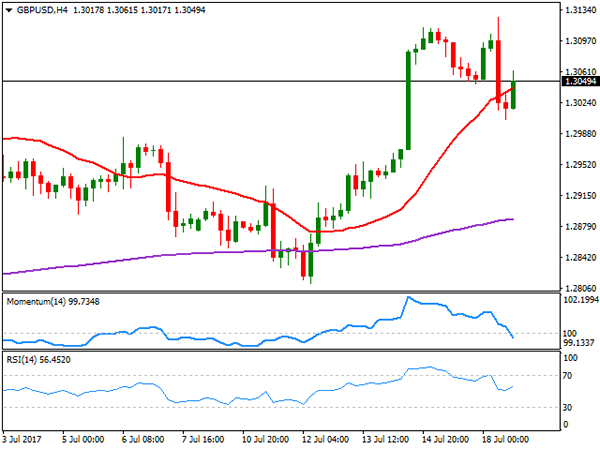
The GBP/USD pair advanced up to 1.3125 a fresh 2017 high at the beginning of the day, but changed course early Europe, and fell to 1.3004, after UK inflation data surprised to the downside. The consumer price index remained unchanged in June, and rose by 2.6% in the same month, but compared to a year earlier, retreating from May’s 2.9% and casting doubts over a possible rate hike in the near-term. Also, core inflation slowed to 2.4% YoY from 2.6% a month ago, while the producer price index slowed for the second time this year, with factory output prices up 3.3% on the year, down from previous 3.6%. Carney presented the new £10 bill in the afternoon and said that today’s data is consistent with BOE’s projections that inflation will stay above target for some time, somehow confirming what the market suspected about a delay in a rate hike. The pair managed to bounce amid persistent dollar’s weakness, with the 4 hours chart now showing that the price is battling to recover above an anyway bullish 20 SMA, whilst the RSI indicator aims modestly higher within neutral levels, and the Momentum heads lower around its 100 line, all of which limits chances of a bearish move, but is not enough to confirm a firmer recovery.
Support levels: 1.3000 1.2965 1.2920
Resistance levels: 1.3070 1.3125 1.3160
GOLD
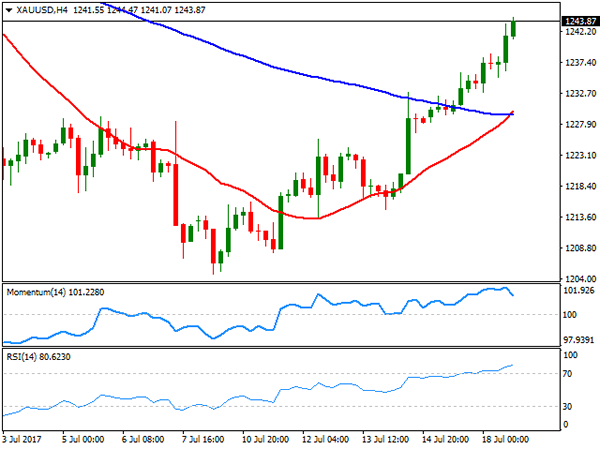
Spot gold surged to a fresh July high, of $1,244.47a troy ounce, ending the day a few cents below it, amid broad dollar’s weakness. The commodity accelerated its recovery, underpinned by arising political jitters in the US, and on fading prospects of strong tightening coming from the Fed. Additionally, the bright metal found support from increasing physical demand coming from India, one of the world’s largest consumer of gold. The steady recovery that left the price at two-week highs seems poised to extend according to the daily chart, as the price advanced further above its 20 and 200 DMAs, whilst technical indicators are currently crossing their mid-lines, entering positive territory. The 100 DMA in the mentioned chart stands flat around 1,252.50, acting as resistance for this Wednesday. In the 4 hours chart, technical indicators have eased modestly, but remain within extreme overbought territory, but the price is well above its 20 and 100 SMAs, with the shortest crossing above the largest, anticipating some additional advances for the upcoming sessions.
Support levels: 1,237.95 1,228.30 1,216.60
Resistance levels: 1,245.20 1,252.50 1,261.90
WTI CRUDE OIL
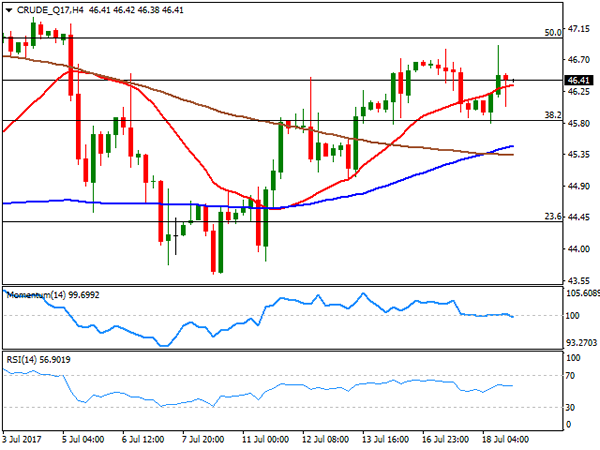
Crude oil prices edged higher on Tuesday, with West Texas Intermediate crude futures ending the day at $46.41 a barrel, backed by a report saying that Saudi Arabia is considering cutting crude exports, by 1 million barrels a day, also helped by dollar’s weakness, as investors rushed away from the American currency. Ahead of US stockpiles reports, the daily chart for the commodity shows that buying interest surged on a test of a Fibonacci support, the 38.2% retracement of its latest slide at 45.90, while the 20 DMA maintains a bullish slope a few cents below it, as technical indicators bounced from their mid-lines, all of which supports additional advances ahead, although the commodity would need to break above the 47.00 level to be able to advance further, level that attracted sellers last week. Shorter term, and according to the 4 hours chart, the technical outlook is neutral-to-bullish, as the price settled above a bullish 20 SMA, but technical indicators lost upward strength, now hovering around their mid-lines.
Support levels: 45.90 45.20 44.60
Resistance levels: 46.60 47.10 47.70
DJIA
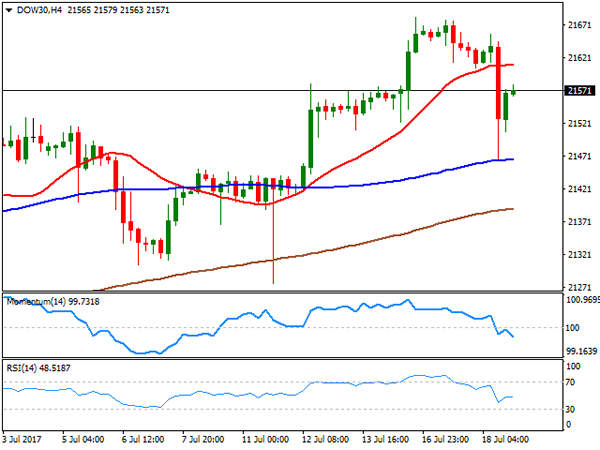
Wall Street closed the day mixed, with the Dow Jones Industrial Average down 53 points, to 21,576.03, but the Nasdaq Composite and the S&P ending higher and at record highs, with the first up 29 points, to 6,344.31 and the second adding 0.06%, to end at 2,460.61. The technical sector was the best performers, but banks fell on the back of soft earnings reports. Goldman Sachs was the worst performer within the DJIA after reporting a 40% decline in trading business. Advancers, on the other hand, were led by Johnson & Johnson that closed 1.93% higher. US indexes reversed its early losses, with the Dow’s daily chart showing that, despite closing in the red, the positive tone persists as strong buying interest contained the decline around a bullish 20 DMA, currently at 21,467, whilst technical indicators retreat within positive territory, still well above their mid-lines. In the 4 hours chart, and for the short term, the index is bearish, having broken below a now flat 20 SMA, and with technical indicators heading lower within negative territory.
Support levels: 21,531 21,467 21,411
Resistance levels: 21,581 21,645 21,682
FTSE100
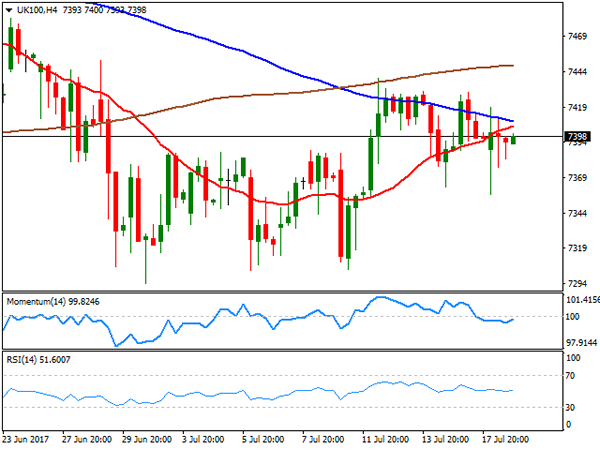
The FTSE 100 saw a limited decline, ending the day at 7,390.22, down 0.19% or 14 points, with a weaker Pound preventing UK shares from falling sharply. Earnings reports across the region disappointed, weighing on the main indexes. Within the Footsie, Experian led decliners with a 2.05% loss, as the company’s results fell short of market’s expectations, followed by Barclays that ended 1.91% lower. G4S was the best performer, up 3.43%, followed by British Land CO which added 3.15%. The daily chart for the London index presents a neutral stance, with technical indicators flat around their mid-lines and the benchmark settling above a bearish 20 DMA. In the 4 hours chart, the index continues developing below all of its moving averages, while technical indicators turned marginally higher, but are stuck around their mid-lines, failing to provide clear directional clues.
Support levels: 7,362 7,333 7,304
Resistance levels: 7,413 7,439 7,482
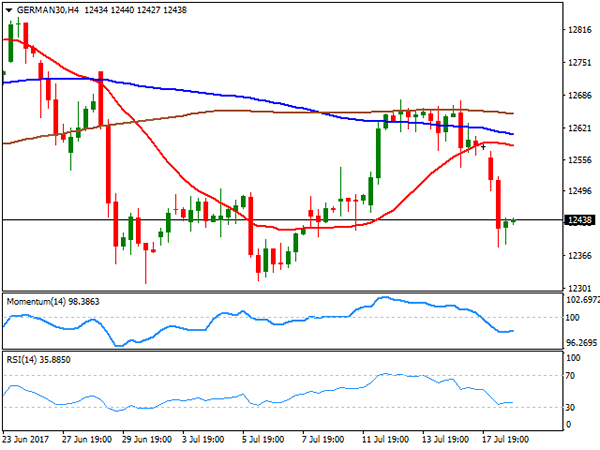
DAX
European equities closed mixed, with the German DAX down 44 points or 0.35%, to 12,587.16. Most sectors closed lower, with only eight members up, led by Deutsche Lufthansa that added 2.28%, after the company reported earnings before interest and taxes of €1,042 million in the first half of 2017. Deutsche Boerse was the worst performer, ending the day 1.53% lower, followed by Merck that lost 1.50%. The daily chart for the index shows that it retreated towards its 20 DMA that presents a modest bearish slope, while the 100 and 200 DMAs remain well below the shortest, whilst technical indicators hover around their mid-lines, with no clear directional strength. In the 4 hours chart, the index settled above all of its moving averages, now a few points below a bullish 20 SMA, whilst technical indicator extended their slides, with the Momentum indicator having entered negative territory and the RSI indicator around 52. The index could extend its decline on a break below 12,542, Friday’s low, and a strong static support area, as it presents multiple intraday highs and lows around the level in the past few weeks.
Support levels: 12,541 12,488 12,432
Resistance levels: 12,621 12,665 12,710