EUR/USD
It was a really bad day for the greenback, but the common currency was unable to benefit from its rivals’ weakness, plunging with the strong momentum triggered in worldwide equities by Fed’s Yellen. The chief of the American central bank testified before the Congress, with her statement released 90 minutes before the event. The document was seen as dovish, as policymakers noted uncertainty surrounding inflation, and while reaffirming that they are still in the tightening path, it won’t take much more rate hikes to reach what they consider ‘normal.’ After the statement and the Q&A, market players reconsidered that Yellen was not that dovish after all, but the dollar remained under pressure anyway, as news coming from different fronts, such as Canada rising rates, or strong employment data in the UK, fueled demand for high yielding currencies.
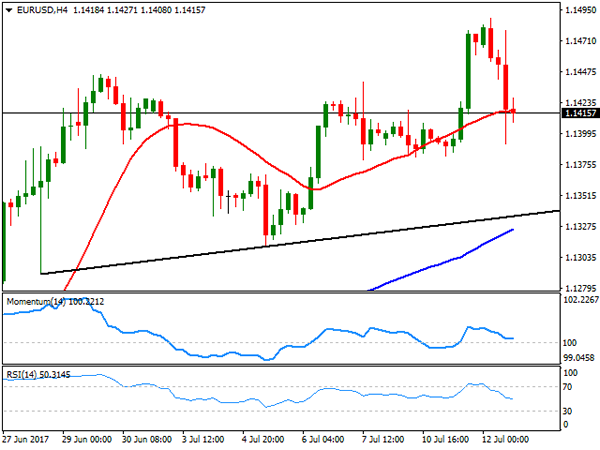
The EUR/USD pair closed the day above the 1.1400 figure, having reached a fresh 2017 high of 1.1489 at the beginning of the day, and despite the sharp intraday retracement, the downward potential remains limited according to the 4 hours chart, as the price settled a few pips above a still bullish 20 SMA, whilst technical indicators are currently bouncing from their mid-lines, after correcting overbought conditions reached earlier on the day. The pair has an immediate support in the 1.1380/90 region, where buying interest surged ever since the week started, followed by a daily ascendant trend line currently around 1.1340.
Support levels: 1.1385 1.1340 1.1290
Resistance levels: 1.1460 1.1490 1.1525
USD/JPY
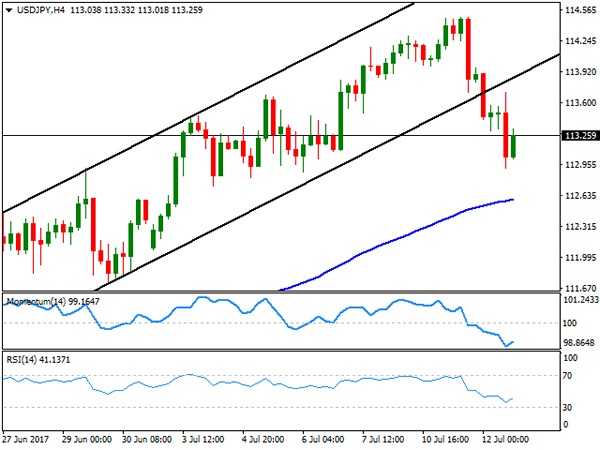
The USD/JPY pair plunged to 112.92, down for a second consecutive day on softening US Treasury yields following Yellen’s latest remarks. The head of the Fed gave her semi-annual monetary policy testimony before the Congress, and while the statement was not actually dovish, it stalled short from backing the greenback, as she suggested that, while still in the tightening path, rates won’t rise much more during the upcoming years. Stocks and bonds surged, leading to a sharp decline in yields, the main motor for yen crosses. Now trading around 113.20, the 4 hours chart shows that the decline accelerated after the price broke below the base of the daily ascendant channel that led the way since early June, while technical indicators pared their declines, holding near oversold readings. In the same chart, the price remains above its 100 and 200 SMAs, with the shortest now in the 112.50 region, offering a key intraday support, as below it the bearish momentum will likely accelerate.
Support levels: 112.85 112.50 112.10
Resistance levels: 113.60 114.00 114.40
GBP/USD
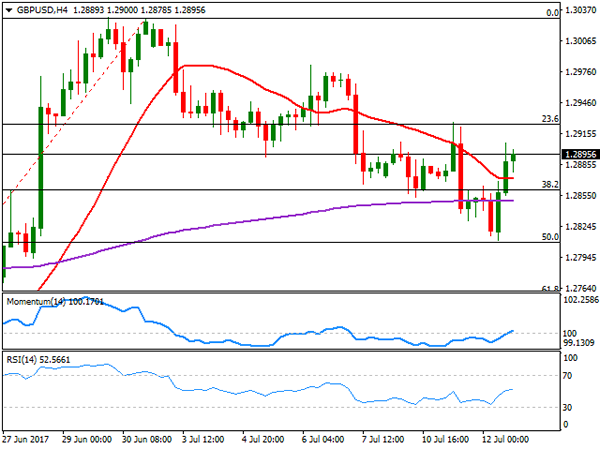
The Pound surged against the greenback reverting its early weekly losses, getting a boost from solid UK employment data, as in the three months to May, there were 32.01 million people in work, 175K more than in the previous three months, while the unemployment rate fell to its lowest since 1975, down to 4.5%. Wages grew by 2% in June, against an expected 1.9% rate of expansion, and above a revised 1.8% in May, but lag when compared to inflation. The GBP/USD pair settled a few pips below the 1.2900 level, bouncing from a daily low of 1.2811, level achieved after BOE’s Broadbent said that he is not ready to hike rates. The pair bounced by the pip from the 50% retracement of its latest rally, recovering also above the 38.2% retracement of the same rally at 1.2860, the immediate support. In the 4 hours chart, the price has settled above a flat 20 SMA, while technical indicators are now stuck around their mid-lines, with no clear directional strength, limiting chances of a steeper recovery, as long as the price remains below 1.2925, the next Fibonacci resistance and this week’s high.
Support levels: 1.2860 1.2810 1.2770
Resistance levels: 1.2895 1.2925 1.2960
GOLD
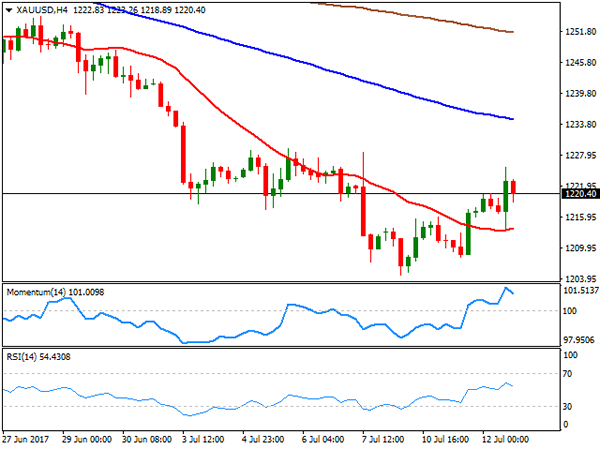
Spot gold advanced for a third consecutive session to close the day at $1,220.20 a troy ounce, albeit gains were once again modest, as despite Fed’s Yellen was less hawkish than expected, she confirmed the US Central Bank plans to keep on rising rates and start shrinking its balance sheet later this year. The commodity posted a daily high of 1,225.63 before retreating, and the overall outlook keeps favoring the downside, as the recovery was rejected from its 200 DMA, with technical indicators in the daily chart still heading modestly higher within negative territory, and the 20 DMA extending its slide well above the current level. In the 4 hours chart, spot met intraday buying interest around a horizontal 20 SMA whilst technical indicators lost upward momentum and turned lower, still holding within positive territory. Below 1,212.80, the risk turns towards the downside, with scope then to extend its slide pass the 1,2000 threshold.
Support levels: 1,212.80 1,204.75 1,194.95
Resistance levels: 1,225.60 1,236.50 1,242.50
WTI CRUDE OIL
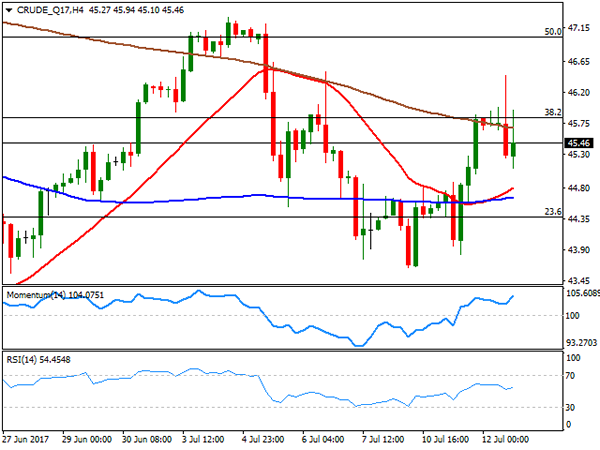
West Texas Intermediate crude oil futures closed the day down at $45.50 a barrel after peaking at 46.45 on a surprise drawdown in US crude stockpiles. The EIA weekly report showed that US crude stockpiles fell by 7.6 million barrels in the week ended July 7th, with the headline sending the price higher. The report, however, also showed that total local crude production edged up by 59,000 barrels a day to 9.397 million barrels in the same week. Additionally, gasoline stockpiles fell by 1.6 million barrels, but distillate stockpiles climbed by 3.1 million barrels. In the news, the OPEC said it will hold an extraordinary meeting on July 17th. Daily basis, the commodity was unable to sustain gains beyond 46.60, the 38.2% retracement of its latest decline still trading above a flat 20 SMA but far below bearish 100 and 200 SMAs, whilst technical indicators have turned lower, lacking clear directional strength right above their mid-lines. In the 4 hours chart, technical indicators head north within positive territory, with the price still below a bearish 200 SMA.
Support levels: 45.10 44.60 43.70
Resistance levels: 45.90 46.60 47.25
DJIA
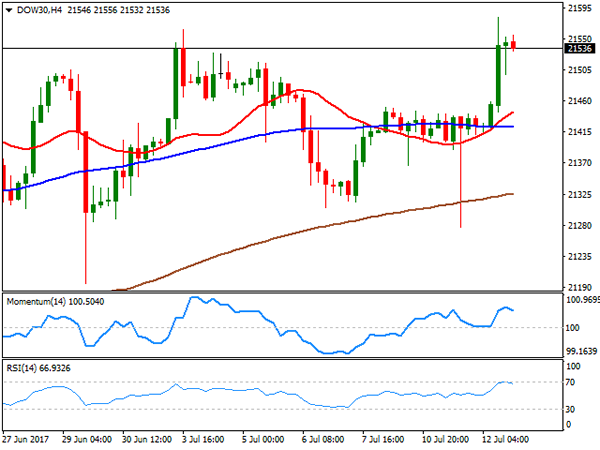
Wall Street soared, with the Dow Jones Industrial Average reaching an all-time high and ending the day 123 points higher at 21,532.14. The Nasdaq Composite added 67 points or 1.10% to end at 6,261.17 while the S&P closed the day at 2,443.25, up 17 points. Gains were a result of Fed’s Chair Janet Yellen semi-annual testimony before the Congress, as she said the Central Bank is likely to start reducing its massive $4.5 trillion portfolio sometime this year, but also that won’t take much more rate hikes to reach a neutral level, providing the exact dose of confidence in the local economy, without overwhelming investors with higher rates. Within the Dow, only JP Morgan edged lower, ending the day -0.36%, while El du Pont was the best performer, up 2.89%, followed by Microsoft which gained 1.63%. The daily chart for the Dow shows that the index extended its recovery beyond its 20 DMA, whilst technical indicators aim north within positive territory, with plenty of room to extend their advances. In the 4 hours chart, the index stands far above all of its moving averages, with the 20 SMA now advancing above the 100 SMA, and technical indicators losing upward strength, retreating modestly from overbought levels.
Support levels: 21,499 21,451 21,406
Resistance levels: 21,527 21,581 21,640
FTSE100
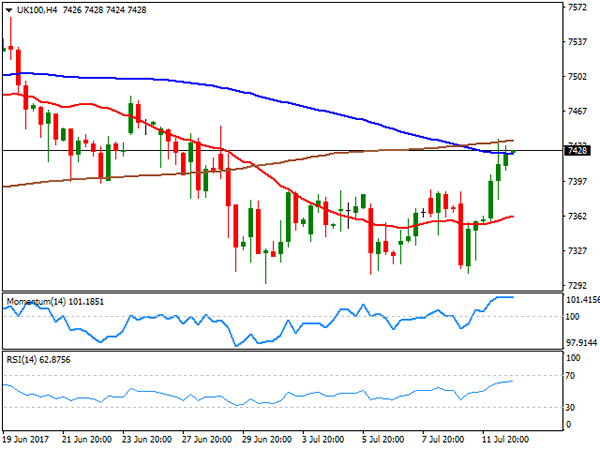
London equities benefited from rising oil prices and the positive mood triggered by US Fed’s Yellen among stocks’ traders, as a slower pace or rate hikes usually supports demand for high-yielding assets. The Footsie added 88 points or 1.19% to settle at 7,416.93, accelerating north ahead of the close as US equities jumped to record highs. Pharmaceuticals and miners led the advance, with Mediclinic up 4.72%, followed by Burberry Group that gained 3.16% and Antofagasta that gained 3.14%. Micro Focus International was the worst performer, down 8.10%, followed by Pearson that shed 4.73%. The technical picture becomes to look more constructive in the daily chart, as the index advanced above its 20 and 100 DMAs, whilst technical indicators extended their advances, now entering positive territory. In the 4 hours chart, technical indicators began easing from near overbought levels, whilst the index is stuck around its 100 and 200 SMAs, but above a bullish 20 SMA, limiting chances of a bearish movement.
Support levels: 7,386 7,345 7,302
Resistance levels: 7,439 7,482 7,529
DAX
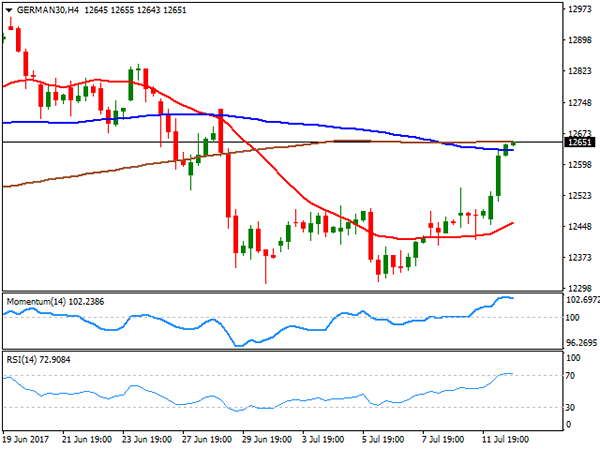
The German DAX closed at 12,626.58, up 192 points or 1.52%, as European equities soared after Fed’s Chair Yellen cooled down expectations of more than a few rate hikes in the next few years. European indexes were already in the rise ahead of the announcement, back by energy and mining-related equities’ gains. Within the DAX, only banks closed lower, with Commerzbank shedding 1.10% and Deutsche Bank down 0.72%. Automakers and pharmaceuticals were on the winning side also, but the best performer was Deutsche Post, up 2.67%, followed by Infineon Technologies that added 2.61%. The index advanced further in after-hours trading, following the lead of Wall Street, gaining upward potential in the daily chart, as the index recovered above its 20 DMA whilst technical indicators extended its advance, still below their mid-lines. In the 4 hours chart technical indicators have pared gains in overbought territory, whilst the index is now struggling around its 100 and 200 SMAs. Further gains seem likely for this Thursday, particularly if stocks’ traders maintain the positive mood in Asia.
Support levels: 12,617 12,565 12,521
Resistance levels: 12,689 12,732 12,774