EUR/USD
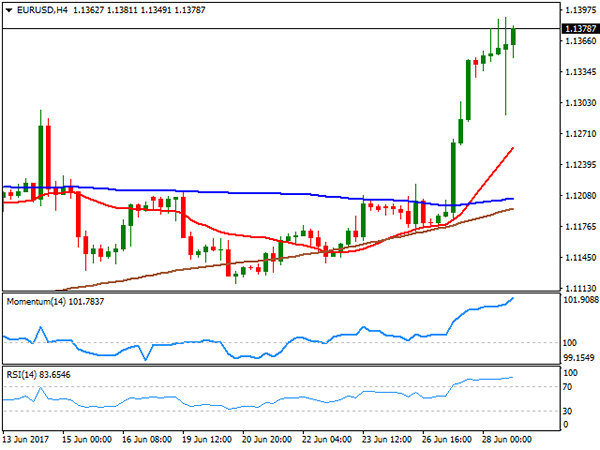
The American dollar was the worst performer for a second consecutive day, followed this time by its Japanese counterpart, while the Pound led the way higher. The EUR/USD pair settled at a fresh high for this 2017, not far from an intraday high of 1.1389, reversing a sudden decline to 1.1290, proving market is now buying the dips. The main market motor continued to be the ECB’s Forum on Central Banking taking place in Portugal. Ahead of Wall Street’s opening, officers from the European Central Bank said that markets "misjudged" Draghi’s Tuesday speech, trying to cold down enthusiasm over upcoming possible tapering. Draghi did the same in his speech later on the day, but failed. The pair fell down to 1.1290 on the initial headline, but quickly recovered ground, surging further after the Pound soared on BOE’s Carney sudden flip in its stance towards rate hikes.
The ECB Form ends this Wednesday, with attention shifting towards the macroeconomic calendar from now, and investors hoping data back the ongoing rallies. This Thursday, Germany will release its preliminary June inflation figures, the EU business sentiment indicators, while the US will offer the last revision of Q1 GDP.
In the meantime, the 4 hours chart for the pair shows that technical indicators resumed their advances after a period of consolidation within extreme overbought levels, whilst the 20 SMA advanced further above the larger ones, but below the current level. The pair seems poised to extend its advance up to the critical 1.1460 region, a strong area that rejected advances pretty much since January 2015. There’s a good chance that an approach to it will trigger profit taking, forcing the pair to retreat, at least partially.
Support levels: 1.1330 1.1290 1.1260
Resistance levels: 1.1390 1.1425 1.1460
USD/JPY
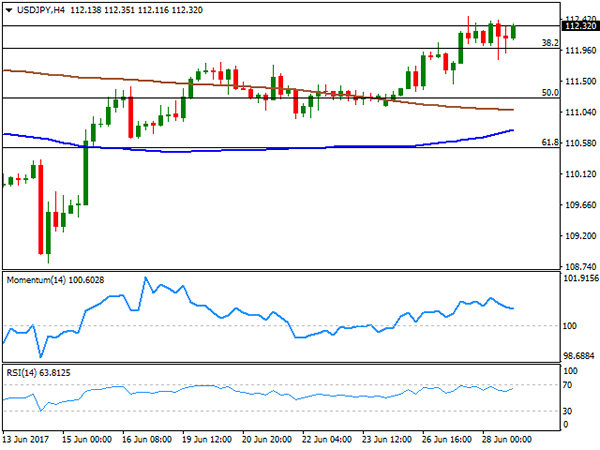
The USD/JPY pair consolidated at the higher end of its weekly range this Wednesday, holding on to gains, despite broad dollar’s weakness amid resurging US Treasury yields. Bond’s sell-off was triggered on Tuesday by ECB’s Draghi, whose optimism on the local recovery spurred speculation for a soon-to-came end of QE in the Euro area. Yields continued advancing, despite the ECB’s President tried to cold down market’s speculation, with the US 10-year note benchmark trading as high as 2.26% intraday, up from previous 2.20% and its highest in over a month. The Japanese macroeconomic calendar will remain empty once again, with more interesting data coming early Friday. Technically, the pair presents a positive short term tone, as a short-lived dip below the 112.00 Fibonacci support was quickly reverted, while the price holds above its 100 and 200 SMAs, as technical indicators are trying to regain the upside after a modest downward corrective movement from near oversold readings.
Support levels: 112.00 111.60 111.20
Resistance levels: 112.45 112.80 113.20
GBP/USD
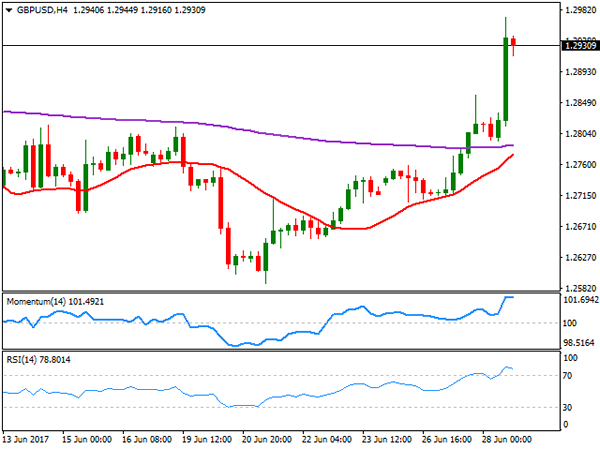
The Sterling soared to as high as 1.2971 against the greenback, its highest since June 8th, as BOE’s Carney surprised market players with a 180 degree turn on monetary policy. Carney said that an interest rate hike will be "necessary" if the global recovery continues, leading to stronger wage growth. Additionally, he said that the global recovery was becoming "broad-based" and that "some removal of monetary stimulus is likely to become necessary if the trade-off facing the MPC continues to lessen and the policy decision accordingly becomes more conventional." The pair retreated from the mentioned high but stabilized above the 1.2900 level. Brexit headlines have been out of focus for nearly a week, but can return to hit Pound any time, although now that PM May got support from the DUP, negative news are not expected short term. In the meantime, the 4 hours chart shows that the 20 SMA has extended its advance below the current level, now nearing the 200 EMA and with technical indicators having turned flat within extreme overbought levels, supporting some consolidation ahead, before the next directional move. Early June high of 1.2977 is the immediate resistance, with a stronger one in the 1.3050 price zone, from where the pair retreated late May.
Support levels: 1.2760 1.2720 1.2670
Resistance levels: 1.2820 1.2855 1.2900
GOLD
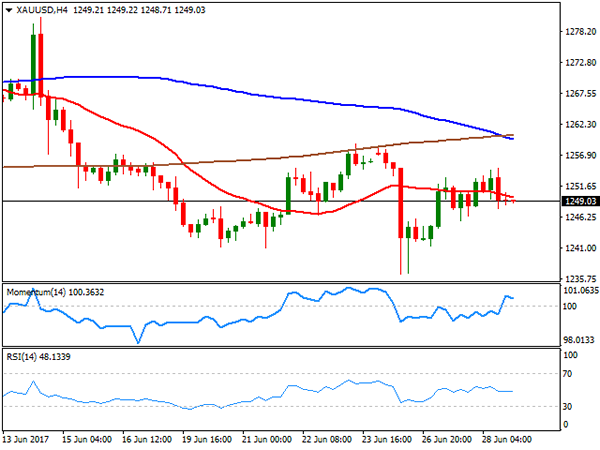
Spot gold advanced intraday up to $1,254.67 a troy ounce, but was unable to hold on to gains, ending the day pretty much flat around 1,249.00. Dollar’s fragile tone gave support to the commodity, despite hawkish central bankers should end up sending the safe-haven asset lower, as confident policymakers usually boost high-yielding assets. Falling bonds’ prices also weighed on gold. From a technical point of view, the daily chart shows that the price remains below its 20 and 100 SMAs, with the shortest still aiming lower above the current level, whilst technical indicators continue lacking clear directional strength, but within bearish territory. In the 4 hours chart, the commodity settled below its 20 SMA, while the 100 SMA is crossing below the 200 SMA, both around 1,260.00, leaning the scale towards the downside. Technical indicators in this last time frame are now neutral, hovering around their mid-lines and with no signs of directional strength.
Support levels: 12,245.50 1,236.45 1,229.35
Resistance levels: 1,258.00 1,265.10 1,273.80
WTI CRUDE OIL
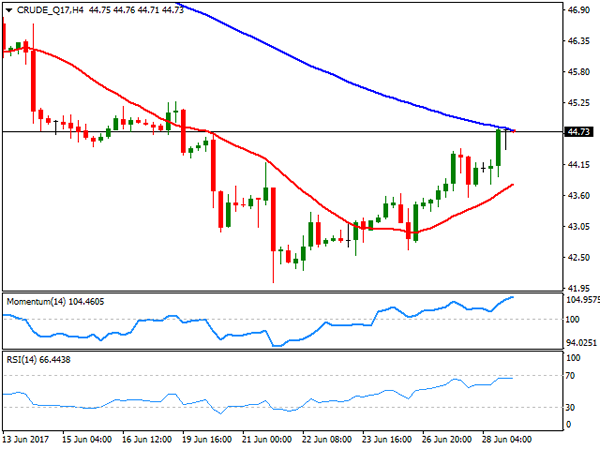
Crude oil prices advanced this Wednesday, with West Texas Intermediate crude futures ending the day at $44.73 a barrel. The EIA report released during the last American session showed that oil stockpiles increased by 0.118 million barrels in the week ended June 23rd, worst that the 3.25 million barrels’ decline expected. But the EIA also informed that gasoline stockpiles fell by 900,000 barrels, while distillates shed 200,000, as the total domestic crude production fell by 100,000 bares a day in the same period. Reducing output brought some relief, but the recovery remains corrective, given that in the daily chart, the advance stalled right at a strongly bearish 20 DMA, whilst technical indicators have corrected higher, but remain within negative territory. In the 4 hours chart, the Momentum indicator keeps heading north well above its mid-line, whilst the RSI indicator turned flat around 66, as the price is being contained by a bearish 100 SMA also around the current level, supporting some additional gains ahead on a break through 44.90, the immediate resistance.
Support levels: 44.30 43.80 43.20
Resistance levels: 44.90 45.60 46.10
DJIA
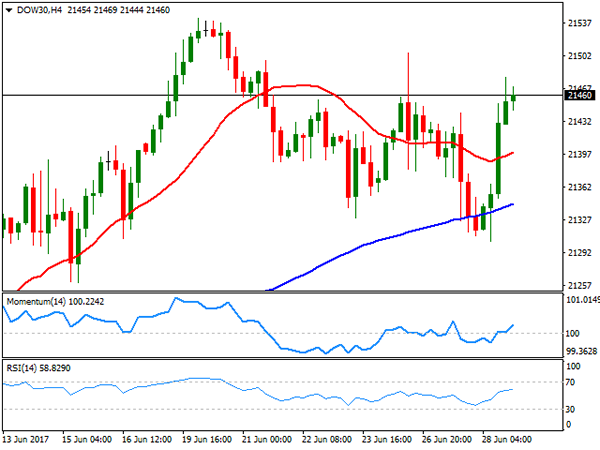
US equities rallied strongly, helped by a bounce in technology and energy-related equities, and hawkish central bankers fueling risk appetite. The Dow Jones Industrial Average added 143 points or 0.68%, to close at 21,454.61, while the S&P gained 21 points, to 2,440.69. The Nasdaq Composite jumped 1.43% higher, to end at 6,234.51. Higher bond yields, added to the positive tone in equities, backing banking shares. Within the Dow, Caterpillar was the best performer, up 2.42%, followed by JPMorgan Chase that added 2.01%. Only six members closed in the red, with Johnson & Johnson leading decliners with a 0.88% lost. The Dow daily chart shows that the benchmark bounced from a bullish 20 SMA, whilst technical indicators found support around their mid-lines, gaining upward traction but still below recent highs, favoring anyway another leg higher for this Thursday. In the 4 hours chart, the index is above all of its moving averages, although the 20 and the 100 SMAs lack directional strength, whilst technical indicators post modest advances within positive territory, enough at least to limit chances of a steeper decline.
Support levels: 21,432 21,389 21,351
Resistance levels: 21,495 21,542 21,590
FTSE100
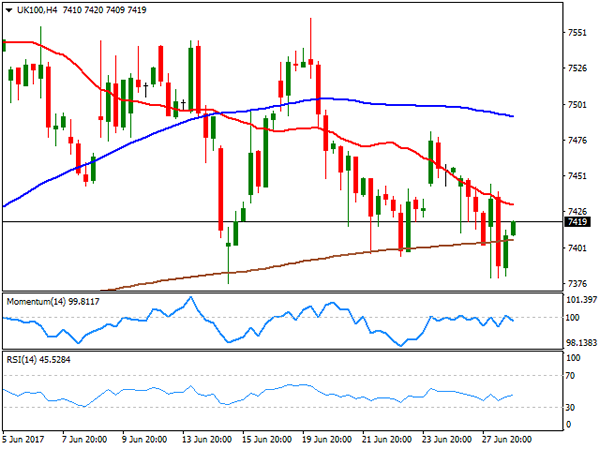
The FTSE 100 closed the day down 12 points, at 7,434.36, with retailers leading the decline, after a profit warning from Debenhams, a local department store that said its full-year profit could come at the lower end of expectations. A sharp advance in the mining sector, however, limited the decline. The Pound jumped higher after London’s close, leading the index further lower in electronic trading, now around 7,403. Glencore led advancers, up 3.73%, followed by Rio Tinto, Anglo American and Antofagasta, all up by over 3.0% GKN was the worst performer, down 4.31%, followed by Admiral Group that shed 2.25%. From a technical point of view, the daily chart shows that the index remained well below a bearish 20 DMA, whilst technical indicators turned south within negative territory, favoring a downward extension for this Wednesday. Shorter term, the 4 hours chart shows that a bearish 20 SMA contained advances, whilst technical indicators also turned lower within bearish territory, with the RSI currently at 38, in line with the longer term perspective.
Support levels: 7,376 7,347 7,298
Resistance levels: 7,442 7,497 7,541
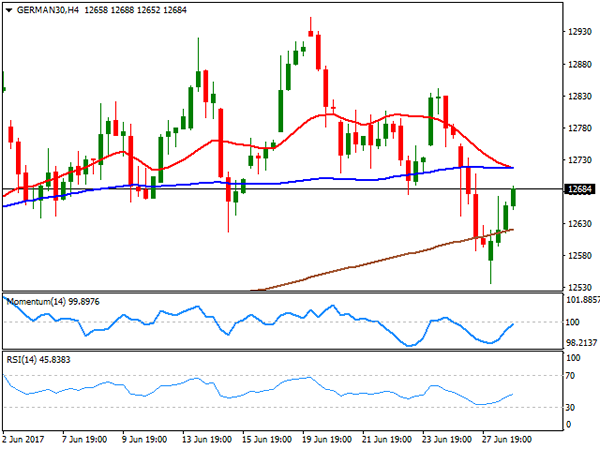
DAX
The German DAX closed the day at 12,671.02, down 99 points or 0.78%, as European equities edged lower following Draghi’s hawkish speech that sent the EUR higher against all of its major rivals. Adding to the negative tone of regional equities were concerns over profits, with the automotive sector undermined by General Motors, as the company lowered its outlook for new sales in 2017. Within the DAX, only three members closed with gains, with Commerzbank that advanced 4.02% and Deutsche Bank, which gained 2.55% topping winners list amid Italian’s banks rescue earlier in the week bringing confidence to the sector. Continental was the worst performer, down 3.70%, followed by E.ON that shed 3.68%. The German index fell further in after-hours trading, following the lead of Wall Street, heading into Wednesday opening right below 12,600, its lowest for this month. The daily chart shows that the index fell and stands well below its 20 DMA, whilst technical indicators are gaining bearish traction, the Momentum around its mid-line but the RSI around 44, this last favoring additional slides ahead. In the 4 hours chart, the index is now below its 200 SMA, having broken below the 20 and 100 SMA earlier on the week and with technical indicators heading sharply lower within bearish territory, maintaining their bearish slopes near oversold territory.
Support levels: 12,587 12,529 12,461
Resistance levels: 12,646 12,707 12,763