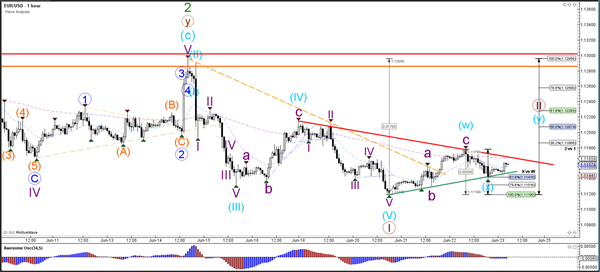
Currency pair EUR/USD
The EUR/USD is probably building a break, retracement, and continuation, which is why waves 1 and 2 (brown) are indicated on the chart. Price will need to break below the bottom at 1.11 before a potential wave 3 becomes likely.
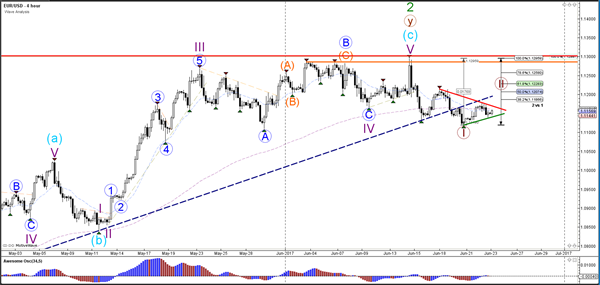
The EUR/USD stopped at the 61.8% Fibonacci level of wave X (blue). A break below support (green) could indicate a continuation of the bearish trend. Price invalidates wave 2 (brown) if price manages to break above the 100% Fibonacci level but the other Fibonacci levels could act as resistance – similar to how price bounced at the 38.2% of wave 2 (brown).
Currency pair USD/JPY
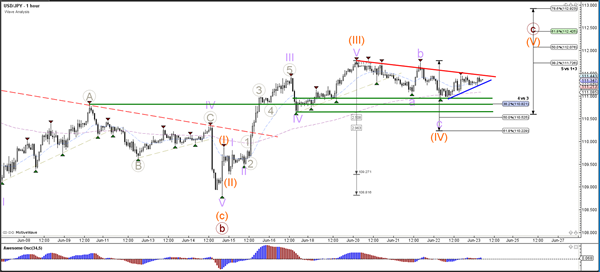
The USD/JPY seems to be building a retracement after the bullish breakout above resistance (dotted red). The pullback is probably a wave 4 (orange) which could find support (green lines) at the previous bottom and tops.
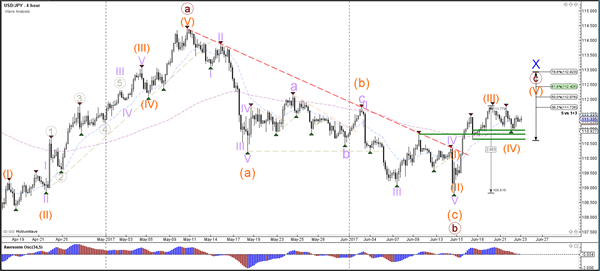
The USD/JPY needs to break above resistance (red) before the wave 5 (orange) could start. A break below the 61.8% Fib of wave 4 vs 3 makes a wave 4 (orange) unlikely.
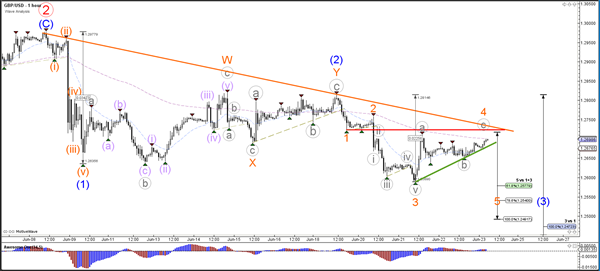
Currency pair GBP/USD
The GBP/USD is challenging resistance lines (red/orange) and a break above these levels would invalidate (part of) the current wave structure.
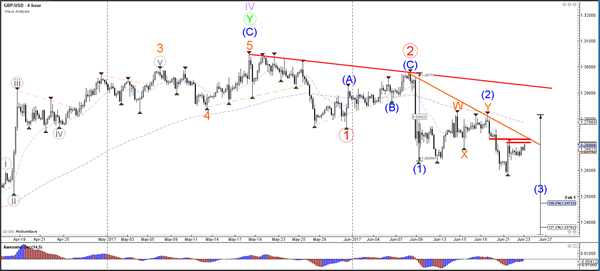
The GBP/USD is in a potential wave 4 (orange) but this wave is invalidated if price manages to break above the bottom of wave 1 (red). A break below support (green) could see the continuation of wave 3 (blue).