EUR/USD
The EUR/USD pair recovered some ground after this Thursday, but the pair remained confined to a tight intraday range and near the lower end of its last 5-week extend. The European macroeconomic calendar remained empty, while in the US, Fed’s officers were once again in the wires talking about unwinding the balance sheet, despite latest weak inflation, although with less impressive headlines. Also, the country released its May Existing Home Sales figures, surprisingly better-than-expected, as home prices rose by 5.8% to a new record. Sales climbed 1.1% to a seasonally adjusted annual rate of 5.62 million in the month, from a downwardly revised 5.56 million in April. This Thursday, the US will release its usual weekly unemployment data, alongside with April housing price index and the Kansas manufacturing index.
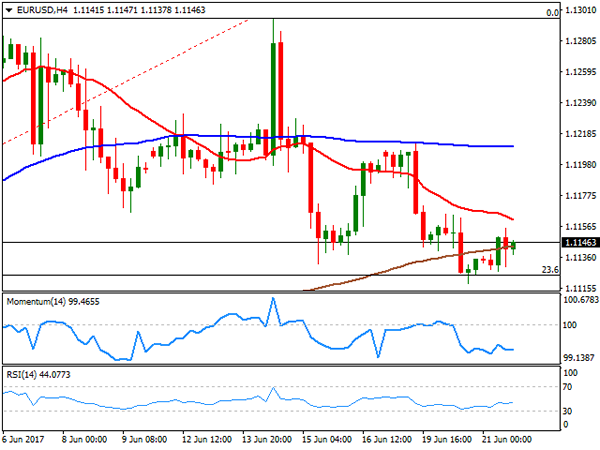
From a technical point of view, the pair has found some support around 1.1125 the 23.6% retracement of its latest bullish between 1.0606, April 10th low, and the high set this June at 1.1295. The pair has also a relevant low at 1.1109 posted on May 30th, with the lowest for the last five weeks being 1.1075, reached on May 18th. A break below this last will likely open doors for a steeper downward move, moreover as the price keeps moving away from the critical 1.1300 mark. In the meantime, the short term picture remains neutral-to-bearish, with the price holding below a strongly bearish 20 SMA that already broke below the 100 SMA, whilst technical indicators hold directionless near oversold readings.
Support levels: 1.1110 1.1075 1.1030
Resistance levels: 1.1220 1.1260 1.1300
USD/JPY
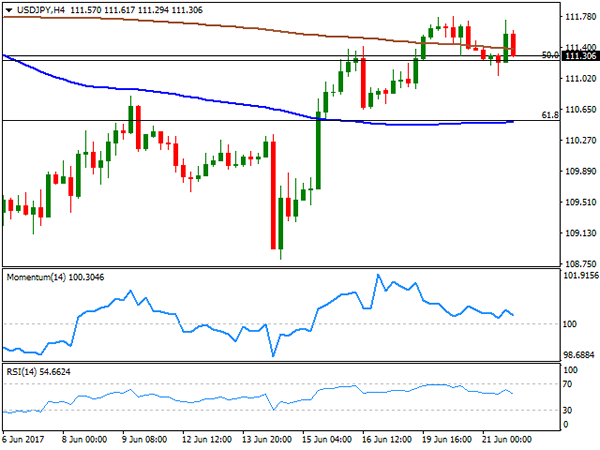
The USD/JPY pair closed the day unchanged around 111.30, still stubbornly attached to yields’ behavior and despite news coming from both major economies. The Bank of Japan released the Minutes of its latest meeting at the beginning of the day, cooling down speculation of tapering surged during the past few weeks. Policy makers officers acknowledged that the amount of government debt purchases will fluctuate under the current quantitative easing programme, but don’t expect that to pose a problem, while also recognized that there’s a long way ahead before inflation reaches the desirable target of 2%. In the US, existing home sales surprised to the upside, up in May by 1.1%, following a notable decline in April of 2.5% according to the official report. Technically, the 4 hours chart shows that the price struggles around a modestly bearish 200 SMA and the 50% retracement of its latest bullish run, while technical indicators eased within positive territory, lacking, however, directional strength, all of which limits chances of further gains ahead. A stronger decline is likely only on a break below 110.50, a strong Fibonacci support.
Support levels: 111.25 110.80 110.50
Resistance levels: 111.60 112.00 112.45
GBP/USD
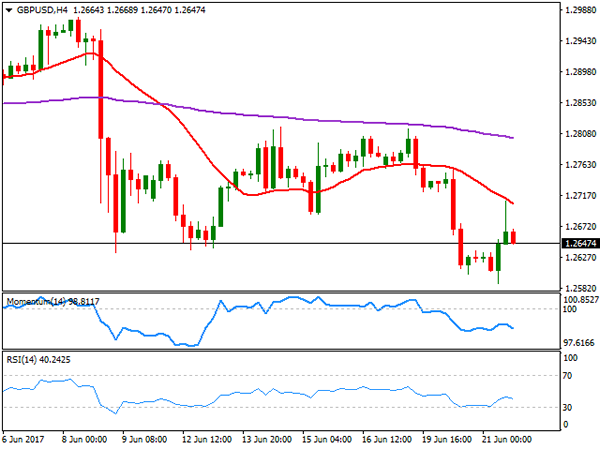
It was a wild ride for the Pound this Wednesday, with the GBP/USD pair sinking to a fresh 2-month low of 1.2588 before bouncing to 1.2709, and then settled midway around 1.2640. The pair fell early London on news indicating that the Democratic Unionist Party (DUP) threatened to walk away from a deal with May’s conservatives. The following bounce was triggered by hawkish comments coming from BOE’s Haldane, who said he is ready to vote for a rate hike amid rising inflation. Haldane didn’t vote for a hike in the latest monetary policy meeting, which pretty much anticipates already 4 hike votes out of 8 MPC members for the next Central Bank meeting. Also, Queen’s speech at the Parliament opening, focusing on getting the best deal possible for the UK on the Brexit, something looking harder day after day, as PM May seems unable to form a government. Mid American afternoon, hundreds of protesters marched to Downing Street, asking for May’s resignation, while another of her top advisors, John Godfrey, quit. The 4 hours chart shows that the intraday rally found sellers around a bearish 20 SMA, currently around 1.2710, while technical indicators have resumed their declines well-below their mid-lines, after correcting oversold readings earlier today. The risk remains towards the downside, with an immediate support now at 1.2635, the post-election low.
Support levels: 1.2635 1.2590 1.2560
Resistance levels: 1.2670 1.2710 1.2750
GOLD
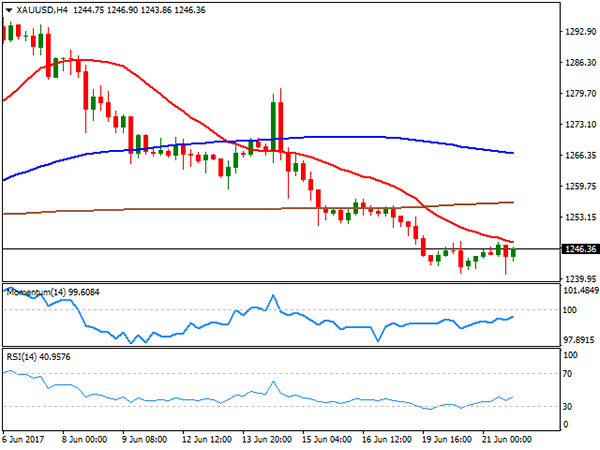
Gold prices consolidate losses around the 1-month low reached this week, with spot adding a few cents daily basis and settling at $1,246.10 a troy ounce. The commodity was unable to attract buyers, despite falling equities, while the downside was limited by diminishing Fed’s surprise headlines on rate hikes and shrinking the balance sheet. The daily chart for the commodity shows that the price peaked right below Tuesday’s high, but still stands below its 20 and 100 DMAs, while technical indicators turned horizontal near well below their mid-lines, limiting chances of a steeper recovery. In the 4 hours chart, the recovery stalled right below a bearish 20 SMA, this last acting as an immediate resistance at 1,248.20 while technical indicators recovered within negative territory, not enough to confirm an upcoming advance. At this point, the commodity would need to advance beyond 1,260.00 to regain its bullish stance and attempt a retest of the 1,300 region.
Support levels: 1,241.95 1,230.90 1,222.80
Resistance levels: 1,248.10 1,257.20 1,265.90
WTI CRUDE OIL
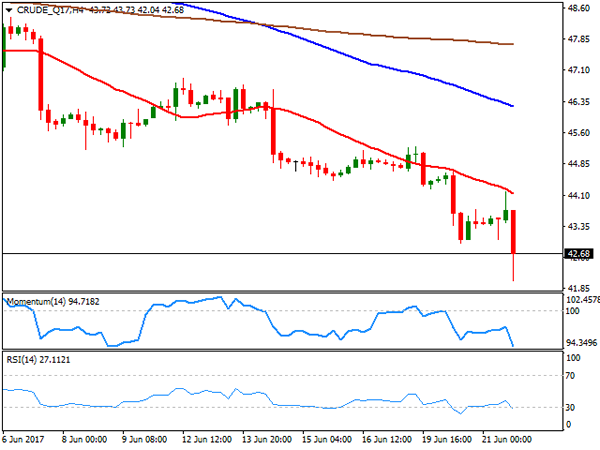
Crude oil prices extended their declines to fresh 2017 lows, despite the EIA weekly stockpiles´ report showed a larger-than-expected draw-down. West Texas Intermediate crude oil prices traded at as low as $42.04 a barrel and settled at 42.66, while Brent fell below $45.00 a barrel. The US Energy Information Administration reported that crude inventories declined by 2.45 million barrels in the week ended June 16th, exceeding expectations for a 2.1 million-barrel drop, with the news triggering a short-lived spike in prices. West Texas Intermediate crude futures quickly turned south as the headline was not enough to revert concerns over a worldwide glut. From a technical point of view, the daily chart shows that technical indicators extended their declines, with the RSI still heading south, despite being at 23, and the price further below its moving averages, in line with further declines. Shorter term, and according to the 4 hours chart, the risk remains also towards the downside, as an early advance was rejected by a bearish 20 SMA, whilst technical indicators are currently consolidating within oversold levels, due to limited volumes at the time being.
Support levels: 42.10 41.65 41.10
Resistance levels: 43.00 43.75 44.50
DJIA
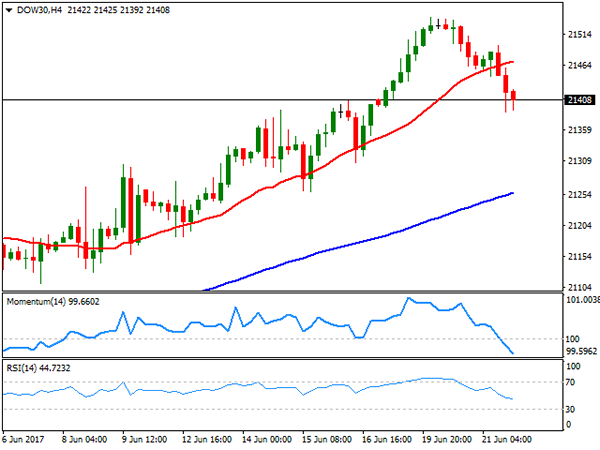
Wall Street closed mixed, with only the Nasdaq Composite managing to advance, up 45 points to 6,233.95. The Dow Jones Industrial Average lost 57 points, and closed at 21,410.03, while the S&P ended pretty much unchanged, down 0.06%, to 2,435.61. The sour sentiment that dominated equities at the beginning of the week was exacerbated by a sharp decline in oil prices to fresh 2017 lows. Within the Dow, Caterpillar led decliners, down 3,52%, followed by El du Pont and Chevron, down 2.65% and 1.82% respectively. Nike was the best performer adding 1.83%. Falling for a second day in a row, the daily chart for the DJIA shows that the movement remains corrective, as moving averages maintain their sharp bullish slopes below the current level, whilst the RSI indicator is barely beginning to correct overbought conditions, now heading lower around 66. In the 4 hours chart, the index is poised to extend its decline, having extended below its 20 SMA and with technical indicators heading south within bearish territory.
Support levels: 21,389 21,351 21,303
Resistance levels: 21,449 21,495 21,542
FTSE100
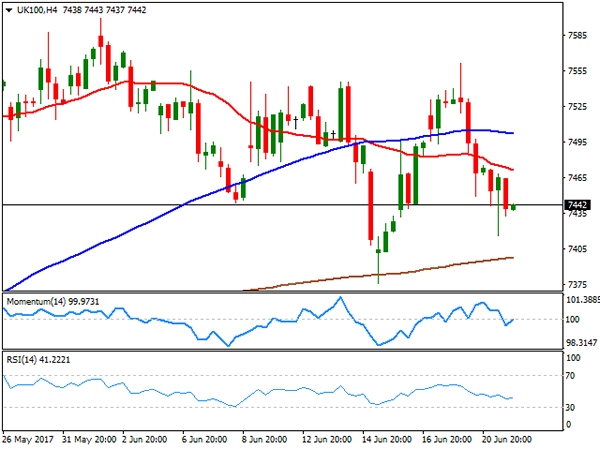
The Footsie edged lower, undermined by a stronger Pound and falling oil prices. The London benchmark settled at 7,447.79, down 24 points or 0.33%, as the Sterling got an unexpected boost from BOE’s Haldane, pledging to vote for a rate hike in the next BOE’s meeting should inflation remain high. Plummeting oil prices weighed on the energy sector, although financials also edged lower across the region. The worst performer was Provident Financial, down by 17.59% after warning a shake-up of its lending division would dent profits much more than previously forecast. Among losers was also Royal Dutch Shell, down 1.34%, and Standard Chartered that lost 1.33%. Whitbread was the best performer with a 3.40% gain. The daily chart for the FTSE 100 shows that the index remains below a directionless 20 DMA but above its 100 DMA, while technical indicator present modest downward slopes right below their mid-lines, maintaining the risk towards the downside. In the 4 hours chart, the technical outlook is neutral-to-bearish as indicators keep hovering around their mid-lines, but the index develops below its 20 and 100 SMA, with the shortest gaining bearish traction.
Support levels: 7,403 7,376 7,327
Resistance levels: 7,499 7,541 7,584
DAX
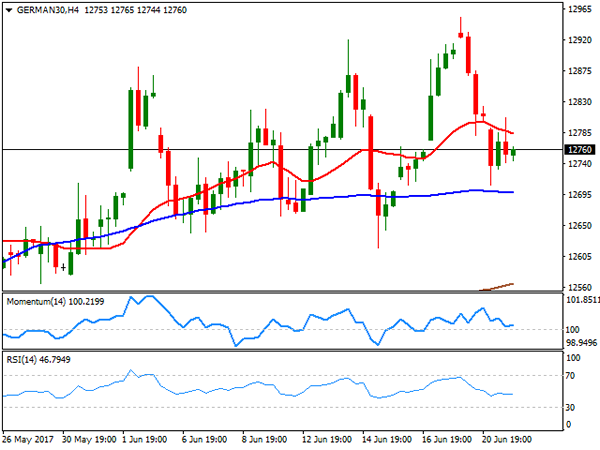
The German DAX closed the day at 12,774.26, down 40 points amid falling oil prices dragging energy-related equities lower. Banks and retailers also edged lower across the region, and within the DAX, Deutsche Boerse was the worst performer, down 1.84%, while Commerzbank shed 0.81% and Deutsche Bank lost 0.35%. Only 5 members closed up, led once again by ThyssenKrupp that added 2.23%. The index closed down for a second consecutive day, now flat weekly basis, and with the daily chart showing that the index met some buying interest on a test of its 20 DMA, now around 12,719, the immediate support, while technical indicators turned lower, still holding above their mid-lines. In the shorter term, and according to the 4 hours chart, the benchmark presents a neutral-to-bearish stance, trading a few points below its 20 SMA but above the larger ones, whilst technical indicators head nowhere around their mid-lines.
Support levels: 12,719 12,653 12,605
Resistance levels: 12,807 12,851 12,892