EUR/USD
The American dollar edged higher this Monday, favored by hawkish comments from Fed´s Dudley towards normalization of monetary policies and a scarce macroeconomic calendar. The EUR/USD failed to regain the 1.1200 level, peaking at 1.1212 before turning south, to settle around its daily low 1.1150. The EU released its construction output figures for April, up in the month by 0.3% after falling 1.1% in March, with the YoY reading coming in at 3.2%, down from previous 3.6%. The common currency was unable to attract buyers, despite in the political front, relief news kept coming. After Greece reached an agreement with its creditors last week, French President Emmanuel Macon’s party and his allies secured an absolute majority in the National Assembly, with over 300 of the total of 577 seats. In the US, Fed’s Dudley spoke at the North Country Chamber of Commerce, in Plattsburgh, offering a confidence stance over inflation and employment, aligned with latest FOMC’s Minutes. Dudley said inflation should pick up as wages rise along with continuing improvement in the labor market.
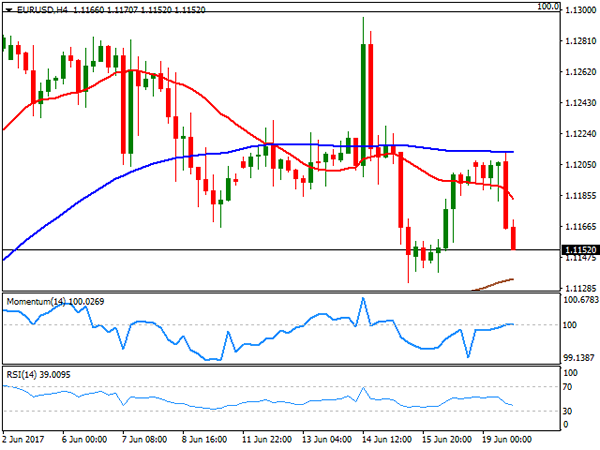
The EUR/USD pair heads into the Asian session with a neutral-to-bearish stance in the short term, having remained contained by its 100 SMA in the 4 hours chart, flat around 1.1220. In the same chart, the price extended below a now bearish 20 SMA, whilst the Momentum indicator stands pat around its 100 level as the RSI heads modestly lower in the 40 region, this last anticipating some additional declines ahead. Still buying interest may surge on an approach to 1.1110, May 30th low and the immediate support, with a critical one standing at 1.1075, the low set on May 18th.
Support levels: 1.1110 1.1075 1.1030
Resistance levels: 1.1220 1.1260 1.1300
USD/JPY
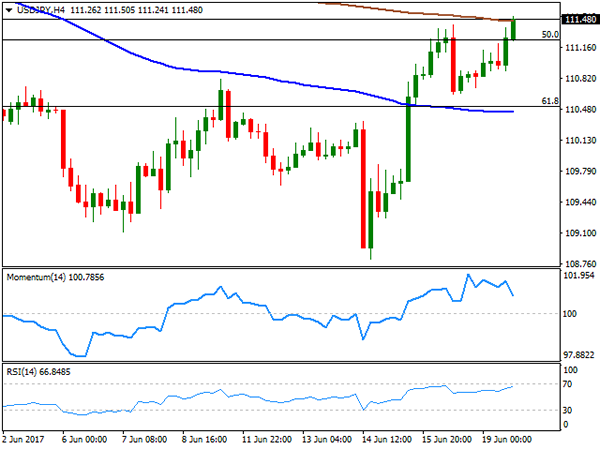
The USD/JPY pair advanced steadily all through this Monday, ending the day not far below a daily high of 111.52. Disappointing Japanese trade balance figures, a confident Fed’s Dudley and rising yields backed the advance. The May Japanese trade balance, released at the beginning of the week, came well below expected, posting a deficit of ¥203.4 billion, missing an expected surplus of ¥76.0B. Imports, however, increased by 17.8% when compared to a year earlier, while exports rose by 14.9%, doubling previous month’s gain but slightly below expected. US Treasury yields advanced during the American session, with the 10-year note benchmark up to 2.19% from previous 2.16%, backing the pair’s recovery. The intraday advance could extend over the next few sessions, as the price recovered above the next Fibonacci level, now the immediate support at 111.25, the 50% retracement of its latest weekly advance. In the 4 hours chart, the Momentum indicator eases within positive territory, rather reflecting the slow advance than suggesting easing upward strength, whilst the RSI indicator advances, currently at 67. In the same chart, the price is trying to advance beyond its 200 SMA also indicating additional gains ahead, initially towards 112.00, the 38.2% retracement of the same rally.
Support levels: 111.25 110.80 110.50
Resistance levels: 111.60 112.00 112.45
GBP/USD
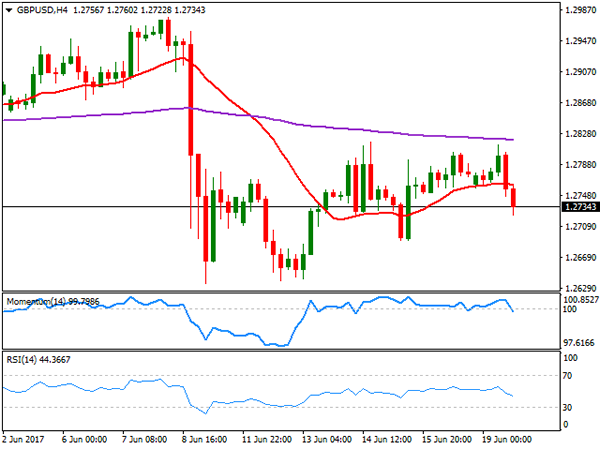
The GBP/USD pair started the day with a strong footing, reaching a daily high of 1.2814 after London’s opening, but fading gains with early Fed’s Dudley speech, later sliding after the official start of Brexit negotiations in Brussels. UK’s David Davis and the EU’s Michel Barnier hold a joint press conference, full of good intentions, but just an introduction to what’s expected to be a long, rough path. Davis highlighted that settling priority issues will build trust on which to negotiate new relationship, while Barnier foreground the constructive approach, saying their off to a promising start. The pair fell down to 1.2722 in the US afternoon, ending the day some pips above the level, still within familiar ranges, but gaining bearish traction short term. In the 4 hours chart, the early advance stalled a few pips below last week’s high and the 200 EMA, this last around 1.2820, while technical indicators turned south, and particularly the RSI stands at 44, anticipating some further slides ahead on a break below 1.2705, February’s monthly high and the immediate support.
Support levels: 1.2705 1.2665 1.2630
Resistance levels: 1.2760 1.2795 1.2830
GOLD
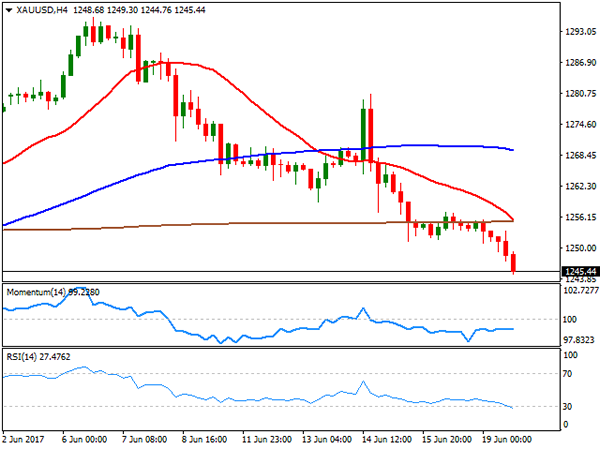
Gold prices continued resumed their decline this Monday, with spot settling at $1.245.50 a troy ounce, its lowest in over a month, on a firmer dollar. Comments from Fed’s Dudley, pretty much repeating Yellen’s statement heard last week, weighed on the bright metal, further dented by a sharp rally in worldwide equities with Wall Street hitting record highs. Sluggish demand from Asian physical buyers at the beginning of the day, also affected gold priced. The daily chart for spot shows that the price has broken below its 100 DMA, extending its decline further below the 20 DMA and with technical indicators accelerating their declines within negative territory, in line with further declines ahead. In the shorter term, and according to the 4 hours chart, the price has settled above all of its moving averages, with the 20 SMA about to cross below the 200 SMA after already breaking through the 100 SMA above the current level, whilst the RSI indicator accelerated its decline, now entering oversold territory and with no sign of changing course.
Support levels: 1,251.10 1,242.50 1,230.90
Resistance levels: 1,257.20 1,265.90 1,271.40
WTI CRUDE OIL
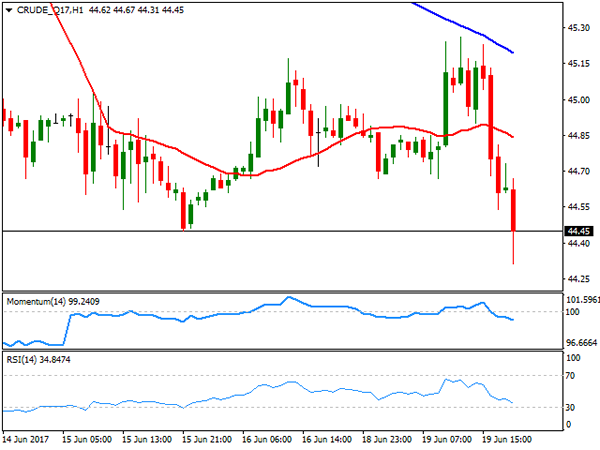
After a positive start of the day, crude oil prices changed course and closed in the red, after falling down to fresh one-month low. Natural gas prices tumbled, as weather forecasts anticipate some cooler conditions ahead, dragging oil prices lower, already sensitive amid increasing US production fueling fears of a worldwide glut. West Texas Intermediate crude futures traded as high as $45.26 a barrel, but closed the day at 44.44, maintaining the bearish technical stance, given that in the daily chart, technical indicators resumed their declines within bearish territory and after a modest upward correction from oversold readings, whilst the 20 DMA continues heading south well above the current level. Shorter term, the 4 hours chart shows that the price settled below a bearish 20 SMA after advancing above it earlier on the day, whilst technical indicators turned south, with the RSI indicator currently at 33, anticipating some further declines on a break below 43.75, the low set on May 5th.
Support levels: 43.75 42.90 42.40
Resistance levels: 45.00 45.65 46.10
DJIA
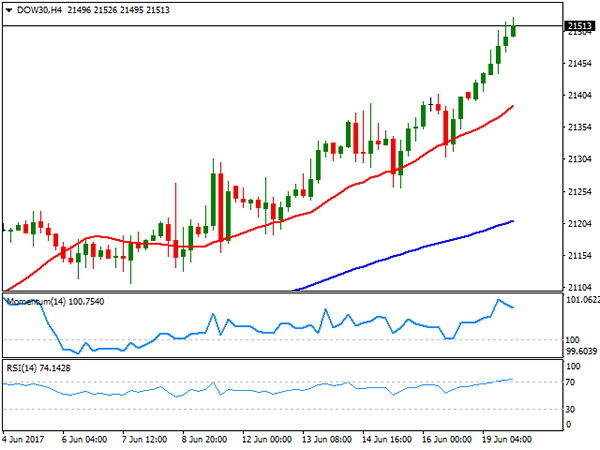
US indexes advanced strongly this Monday, with the Dow Jones Industrial Average and the S&P both closing at record highs. The first added 144 points, and ended at 21,528.99, while the second advanced 20 points, to 2,453.46. The Nasdaq Composite also advanced, settling at 6,239.01, up by 87 points. Stocks rallied on upbeat comments from Fed’s Dudley, also backed by a recovery in the tech sector. Within the DJIA, Apple led advancers with a 2.86% gain, followed by JP Morgan, up 2.19% and Goldman Sachs that added 1.95%. Travelers led decliners, closing down 0.90%, followed by Exxon Mobil that shed 0.87%, down alongside with oil prices. Holding at record highs, the daily chart for the index maintains the positive tone seen on previous updates with the index far above bullish moving averages and the RSI indicator extending its advance within overbought levels, now at 78. In the shorter term, and according to the 4 hours chart, technical readings also favor the upside, with the RSI indicator also heading north within overbought levels, and the benchmark holding far above all of its moving averages.
Support levels: 21,374 21,332 21,282
Resistance levels: 21,410 21,450 21,490
FTSE100
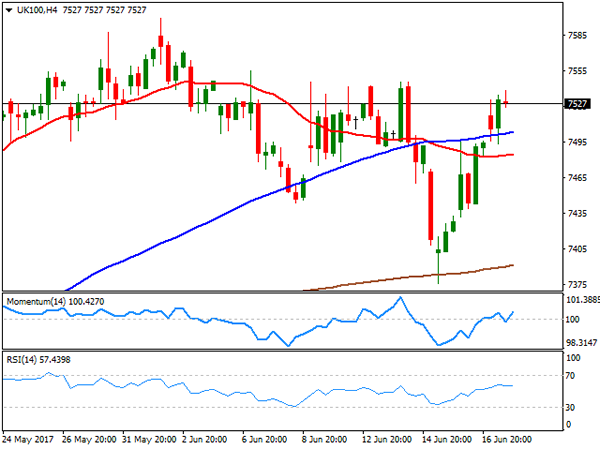
The FTSE 100 advanced 60 points to settle at 7,523.81, boosted by a recovery in the retail sector and the positive tone of equities worldwide. Political relief in Europe, after Greece reached an agreement with its creditors and French Macron locked a parliamentary majority, boosted UK stocks, later supported by a weakening Pound. Within retailers, Sainsbury was the best performer, adding 2.26%, but the winners’ list was led by G4S PLC, up 4.58%. Hammerson, on the other hand, led decliners with a 1.33% loss, followed by Paddy Power Belfair that shed 1.10%. The daily chart shows that the index settled above its 20 DMA, while technical indicators turned higher around, with the Momentum still around its mid-line and the RSI anticipating some further advances, currently at 56. In the 4 hours chart, the Momentum indicator bounced from its mid-line, gaining bullish traction, whilst the RSI indicator stands flat around 57, as the index holds well above its moving averages, all of which maintains the risk towards the upside.
Support levels: 7,510 7,478 7,432
Resistance levels: 7,541 7,584 7,620
DAX
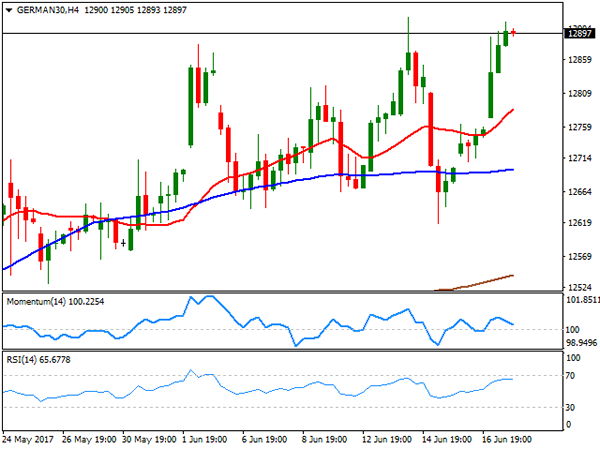
The German DAX advanced 137 points or 1.07% to end at 12,888.95 this Monday, with all major European indexes closing sharply higher, initially fueled by Macron’s party parliamentary victory, and later backed by Wall Street’s solid performance. Within the German benchmark, only three members closed down, with ProSiebenSat.1 Media being the worst performer, down by 0.39%. Leading winners’ list was ThyssenKrupp, up by 2.67%, followed by Deutsche Bank that gained 2.59%. The DAX heads into the Asian opening at 12,906, a record high, maintaining the positive tone seen on previous updates, given that in the daily chart, the 20 DMA slowly turns higher below the current level, whilst technical indicators keep advancing within positive territory. In the shorter term, and according to the 4 hours chart, the Momentum indicator remains stuck around its 100 level, as the advance stalled barely below last week intraday peak of 12,921, while the RSI continues advancing, currently around 66, as the 20 SMA heads north below the current level, all of which supports an upward extension on a break above the mentioned high.
Support levels: 12,871 12,829 12,774
Resistance levels: 12,931 12,960 13,000