EUR/USD
Another day came and went with the EUR/USD pair stuck around 1.1200, unable to react to macro figures released in Europe or the US. Speculative interest is waiting for Fed’s meeting outcome, to decide whether is worthy to resume EUR’s buying or if it’s time to take profits out of the table and bet some chips on the greenback. The overall sentiment is that the US Central Bank will offer a dovish hike, meaning that it will probably pull the trigger and raise rates by 25 bps, but offer a cautious stance about future moves, amid soft data in the US over the last few months.
The macroeconomic calendar will be quite busy this Wednesday, starting with Chinese sales and industrial data, and including German inflation, UK employment, and US inflation among others, and ahead of Fed’s decision, which means some action could be seen across the board, although directional breakouts are quite unlikely.
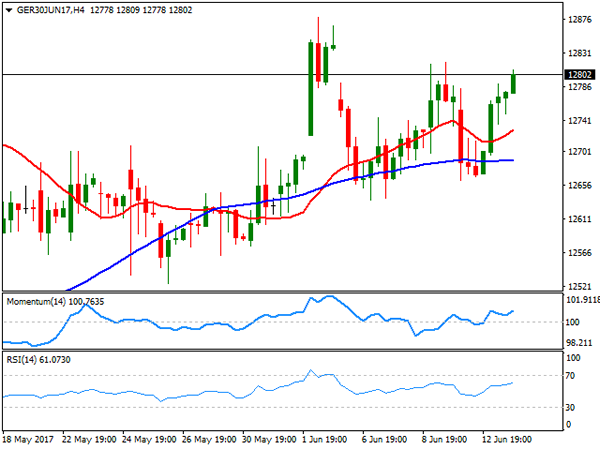
Early Asia, the EUR/USD pair technical picture is short term neutral, as the price has traded within a 60 pips range ever since the week started. The downside potential is well-limited as long as the price holds above the 1.1120 region, where buying interest surged during the past three weeks, but further gains will only be confirmed on a break above 1.1300. In the 4 hours chart, the price remained unable to advance above its 100 SMA, but stands a few pips below it and hovering around a bearish 20 SMA, whilst technical indicators stand flat around their mid-lines, reflecting the ongoing absence of directional strength.
Support levels: 1.1160 1.1120 1.1080
Resistance levels: 1.1250 1.1300 1.1345
USD/JPY
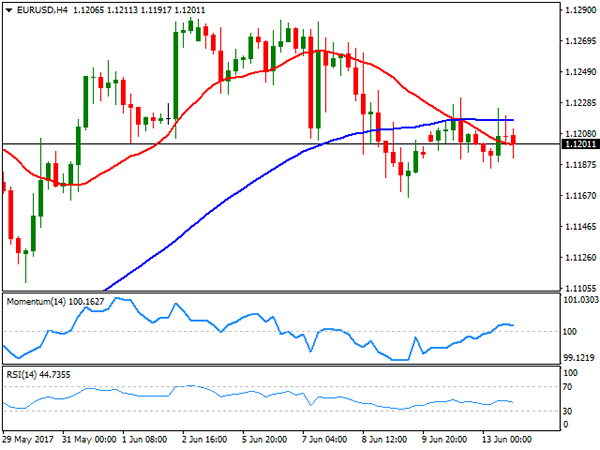
The USD/JPY pair traded around the 110.00 figure all through this Tuesday, peaking at 110.26, but retreating towards the mentioned threshold in the US afternoon, ending the day a couple of pips below it. Back to usual, the Japanese currency was aligned with US Treasury yields, tracking them for direction. Attention in Asia will center in Chinese data, while Japan will release its April Industrial Production figures, these last, hardly enough to trigger strong moves in the pair, moreover ahead of the US Federal Reserve announcement. Technical readings in the 4 hours chart favor a downward extension, given that the intraday recovery stalled short of the 61.8% retracement of its latest rally at 110.50, also below a bearish 100 SMA, now at 110.70. In the same chart, the Momentum indicator accelerated south below its mid-line, but the RSI indicator consolidates around 47, limiting chances of a steeper decline during the upcoming hours. Nevertheless, the risk remains towards the downside, and it will take an unlikely recovery beyond 112.00 to consider an interim bottom and further recoveries afterwards.
Support levels: 109.80 109.30 108.80
Resistance levels: 110.10 110.50 110.80
GBP/USD
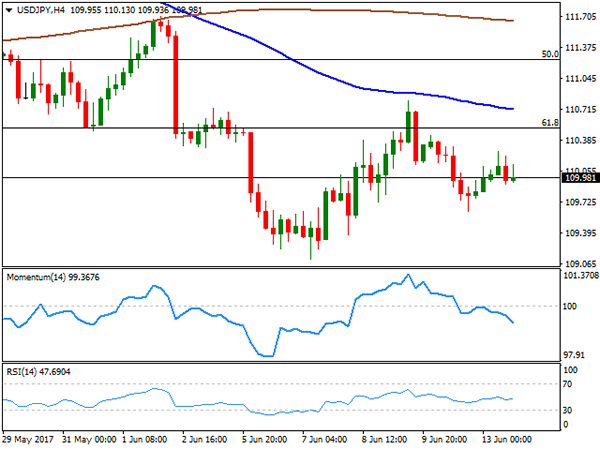
The Sterling recovered nicely this Tuesday, following an advance in UK’s inflation ahead of BOE’s meeting later this week, although chances that the Central Bank will hike rates on this figures are quite null. UK CPI rose to 2.9% in May surpassing consensus of 2.7%. The producer price index, which measures prices at factory gates, remained unchanged at 3.6% YoY, while when compared to April, surged by 0.1%, less than expected. The UK will release its latest employment figures this Wednesday, with the market expecting a decrease in unemployment claims to 10.0K from previous 19.4K and the unemployment rate seen unchanged at 4.6%. Wages, which are forecasted to remain on hold, will be in the eye of the storm after latest inflation readings, as it they match expectations will be bad news for the Pound long term, as the widening gap between both will dent consumption further. From a technical point of view, the upward corrective movement seems to have come to a halt, as in the 4 hours chart, technical indicators were unable to present a clear follow-through beyond their mid-lines. In the same chart, the price is a handful of pips above a bearish 20 SMA, but below the post-election high at 1.2780, now the level to surpass to see the ongoing recovery extending.
Support levels: 1.2705 1.2660 1.2635
Resistance levels: 1.2780 1.2830 1.2870
GOLD
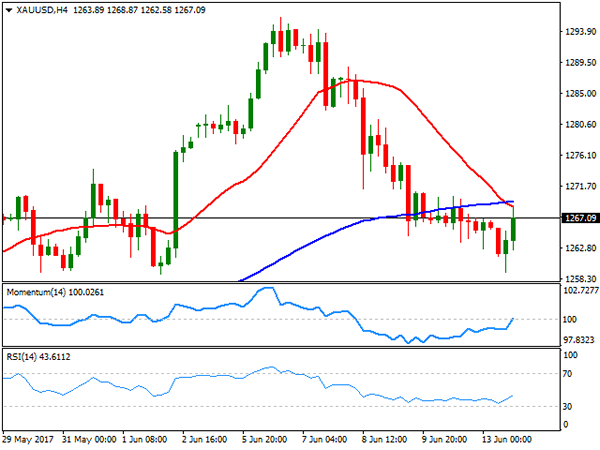
Spot gold fell to a fresh weekly low of $1,259.24 a troy ounce this Tuesday, undermined by speculation the Fed will raise rates this Wednesday. Anyway, the commodity trimmed all of its daily losses, ending the day pretty much flat at 1,267.45. Gold looks vulnerable from a technical point of view, after further retreating from an approach to the 1,300 mark late May, although the downward strength has decelerate this week, according to the daily chart, where technical indicators have turned horizontal around their mid-lines, and with the price right below a horizontal 20 DMA, but above the 100 and 200 DMAs. Shorter term, the 4 hours chart, shows that the price retreated after testing the 20 and 100 SMAs, both converging around 1,269.00, while technical indicators have recovered within negative territory and are about to challenge their mid-lines, indicating that a strong advance beyond 1,270.00 is required to revert the latest bearish strength.
Support levels: 1,263.50 1,253.20 1,245.50
Resistance levels: 1,271.40 1,282.60 1,295.90
WTI CRUDE OIL
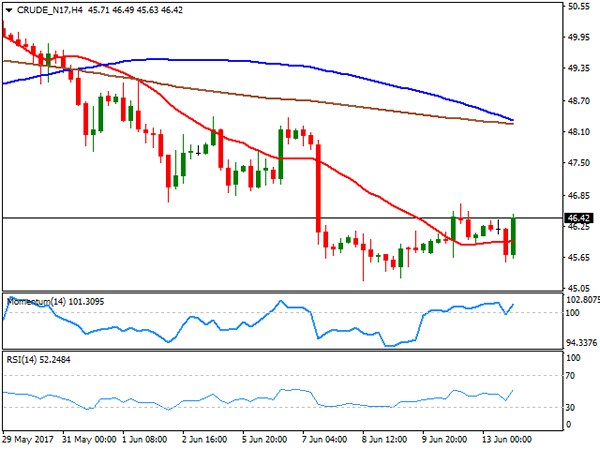
Crude oil prices advanced modestly ahead of US inventories data, with West Texas Intermediate futures settling at $46.42 a barrel, not far below its weekly high of 46.69. The commodity started the day with a sour tone, weighed by news that OPEC’s crude oil production in May rose, despite the output cut deal, up by 336K barrels per day to average 32.12 million bpd, amid rising production in Libya, Nigeria and Iraq. The commodity, however, recovered in the US session, on hopes US stockpiles report will show a large draw-down after last week surprise build. From a technical point of view, the daily chart shows that, despite being up for the last three trading sessions, the upward potential remains well limited, with the price developing far below a bearish 20 DMA, whist technical indicators hold flat within negative territory. In the 4 hours chart, the price has settled above a horizontal 20 SMA, while technical indicators also lack directional momentum and barely above their mid-lines, not enough to confirm further recoveries ahead.
Support levels: 45.90 45.40 44.70
Resistance levels: 46.70 47.35 47.90
DJIA
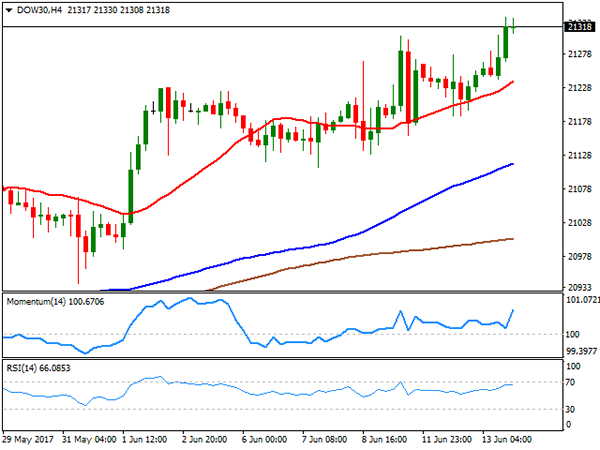
Wall Street edged higher this Tuesday, with the DJIA and the S&P both ending at record highs. A recovery in the tech sector coupled with gains in energy-related currencies, resulting in the Dow Jones Industrial Average adding 92 points to end at 21,328.47. The Nasdaq Composite closed at 6,220.37, up 0.73%, while the S&P added 11 points, or 0.45% to 2,440.35. Within the Dow, El du Pont was the best performer, up 1.72%, followed by Visa which gained 1.67%. General Electric led decliners, ending the day -1.74%, followed by Verizon that shed 1.57%. The Dow’s daily chart shows that the index stands near its intraday record high of 21,332, extending further above its moving averages, and with the shortest, the 20 SMA gaining upward strength. The Momentum indicator turned north after approaching its mid-line, but remains well-below June’s high, while the RSI advanced up to 70, all of which supports additional gains ahead. In the 4 hours chart, technical indicators maintain their upward slopes well above their mid-lines, whilst the 20 SMA also advanced below the current level, in line with the longer term perspective.
Support levels: 21,282 21,241 21,187
Resistance levels: 21,335 21,380 21,410
FTSE100
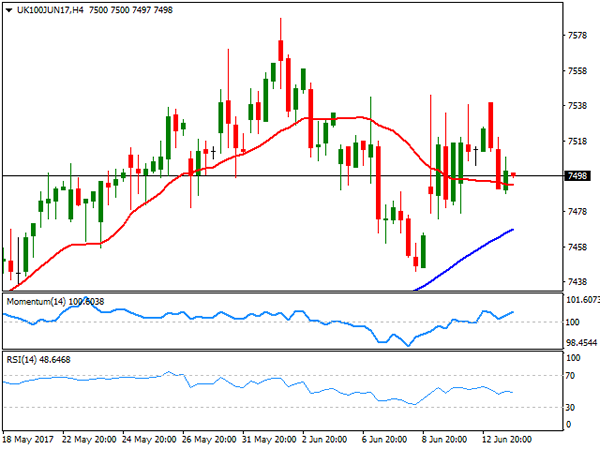
The FTSE 100 lost 11 points or 0.15% to end the day at 7,500.44, as despite improving investors’ mood, a stronger Pound weighed on local shares. Ongoing political uncertainty in the UK, however, kept the benchmark within a limited intraday range, as speculative interest waits for some definitions before taking big decisions. LSE was the best performer, up 5.38%, followed by ConvaTec Group that added 3.02% as the tech sector bounced following the latest selloff. 3i Group led decliners with a 2.96% loss, followed by Merlin Entertainments that shed 2.68%, after saying that recent terror attacks in the kingdom have reduced domestic demand. Daily basis, the Footsie has made little progress, holding around a bullish 20 DMA, and with technical indicators having retreated further within positive territory. Shorter term, and according to the 4 hours chart, the technical picture is also neutral, with the index hovering around its 20 SMA but above bullish 100 and 200 SMAs, whilst technical indicators remain stuck within neutral territory.
Support levels: 7,482 7,445 7,405
Resistance levels: 7,541 7,588 7,620
DAX
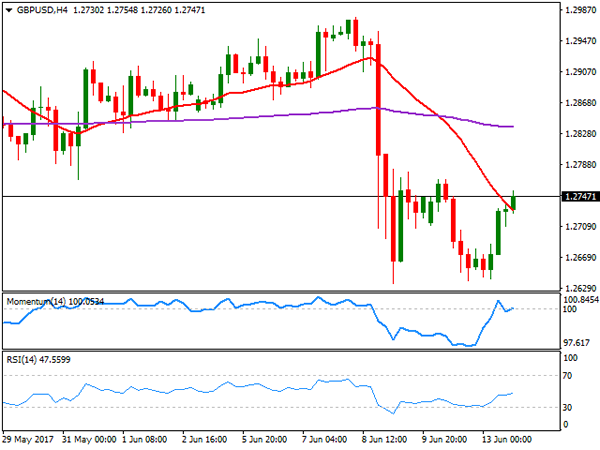
The German DAX managed to add 75 points, to close at 12,764.98, although European equities had a mixed performance. The tech sector bounced after two days of steady losses, supporting DAX’s recovery, alongside with easing risk sentiment. Only five components closed in the red, with Beiersdorf being the worst performer, down 0.48%. Deutsche Lufthansa led advancers, adding 2.75%, followed by Adidas that added 2.28%. Despite the cautious short-term stance, European equities hover near multi-year highs, supported by strong local data and rising optimism, which means that will take little to trigger bullish moves. Technical readings in the daily chart present a neutral-to-bullish stance, as the index held once again above a horizontal 20 DMA, while technical indicators turned modestly higher above their mid-lines, with limited momentum at the time being. In the 4 hours chart, the price advanced above its moving averages that anyway have little directional strength, whilst technical indicators aim higher within positive territory, also with limited upward strength.
Support levels: 12,771 12,734 12,695
Resistance levels: 12,818 12,845 12,880
