
A note on lower timeframe confirming price action…
Waiting for lower timeframe confirmation is our main tool to confirm strength within higher timeframe zones, and has really been the key to our trading success. It takes a little time to understand the subtle nuances, however, as each trade is never the same, but once you master the rhythm so to speak, you will be saved from countless unnecessary losing trades. The following is a list of what we look for:
- A break/retest of supply or demand dependent on which way you’re trading.
- A trendline break/retest.
- Buying/selling tails … essentially we look for a cluster of very obvious spikes off of lower timeframe support and resistance levels within the higher timeframe zone.
- Candlestick patterns. We tend to only stick with pin bars and engulfing bars as these have proven to be the most effective.
We typically search for lower-timeframe confirmation between the M15 and H1 timeframes, since most of our higher-timeframe areas begin with the H4. Stops are usually placed 1-3 pips beyond confirming structures.
EUR/USD
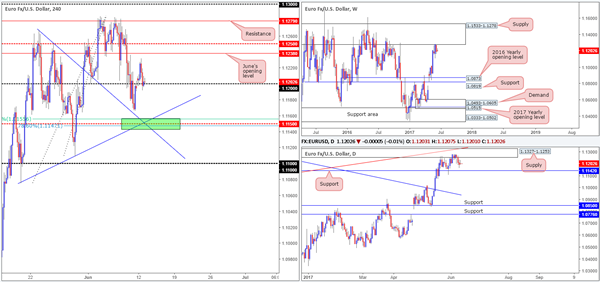
Using a top-down approach this morning, we can see that the single currency remains trading around the underside of a major weekly supply at 1.1533-1.1278. Managing to cap upside since May 2015, this is certainly not an area one should overlook. Looking down to the daily timeframe, however, the candles are now seen sandwiched between supply coming in at 1.1327-1.1253 and support pegged at 1.1142.
Swinging over to the H4 timeframe, the buyers and sellers are currently battling for position around the 1.12 handle. Directly overhead we have June’s opening level at 1.1238, followed closely by the mid-level resistance at 1.1250. Below 1.12, there’s little support until price connects with the mid-level barrier at 1.1150.
Our suggestions: Based on the above notes our desk has shown interest around the 1.1150 neighborhood, due to the base converging with the following structures (green area):
- A H4 trendline support taken from the high 1.1268.
- A H4 trendline support etched from the low 1.1075.
- A H4 61.8% Fib support at 1.1155 drawn from the low 1.1074.
- A H4 78.6% retracement level pegged at 1.1147 penciled in from the low 1.1109.
- A daily support level seen at 1.1142.
Seeing as how this zone is rather small, we will not be placing pending buy orders here. Instead, we’ve chosen to wait for a reasonably sized H4 bull candle to form, preferably a full-bodied candle. This will help prove buyer interest exists here which IS needed due to where price is trading from on the weekly chart right now.
Data points to consider: German ZEW economic sentiment at 10am. US PPI at 1.30pm GMT+1.
Levels to watch/live orders:
- Buys: 1.1150 region ([waiting for a reasonably sized H4 bull candle – preferably a full-bodied candle – to form before pulling the trigger is advised] stop loss: ideally beyond the candle’s tail).
- Sells: Flat (stop loss: N/A).
GBP/USD
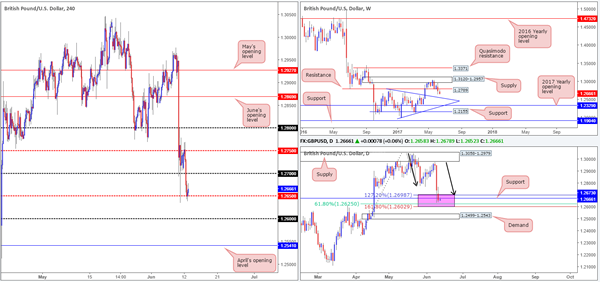
Beginning with the daily timeframe this morning, we’ve underlined a particularly interesting zone marked in pink. Comprised of a support level coming in at 1.2673, a 61.8% Fib support at 1.2625 (taken from the low 1.2365) and an AB=CD (black arrows) 127.2/161.8% ext. completion point seen at 1.2602/1.2698 (drawn from the high 1.3047), this is a possible zone of interest for the bulls. Below the area, nonetheless, is a demand located at 1.2499-1.2543, which happens to intersect beautifully with a weekly trendline support taken from the high 1.2774.
As we write, the H4 candles are bouncing off the mid-level support at 1.2650. This hurdle held nicely on Friday, despite the market’s bearish tone following the UK elections. Above this level we have the 1.27 handle, while below we see the 1.26 level (1.26 essentially denotes the lower edge of the daily zone highlighted above).
Our suggestions: This is a challenging market to trade at the moment. On the one hand we have the daily picture indicating that buying could be on the cards, and on the other hand the weekly chart shows room to move beyond the daily zone. So therefore, it’s hard to place trust in the H4 mid-level support at 1.2650 for a long trade.
Data points to consider: UK inflation figures at 9.30am. US PPI at 1.30pm GMT+1.
Levels to watch/live orders:
- Buys: Flat (stop loss: N/A).
- Sells: Flat (stop loss: N/A).
AUD/USD
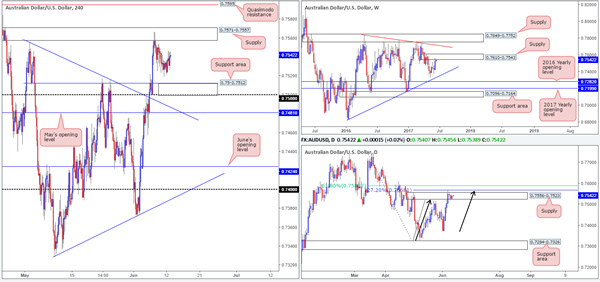
In view of weekly price recently shaking hands with supply coming in at 0.7610-0.7543, the sellers could very well make an appearance from here this week. In conjunction with weekly flow, daily action also recently whipsawed above supply formed at 0.7556-0.7523 and touched base with an AB=CD 127.2% completion point (see black arrows) at 0.7568 (taken from the low 0.7328). This move likely took out a truckload of buy stops from above the said supply and thus provided enough liquidity for the big boys to sell into.
Moving across to the H4 candles, price failed to reconnect with the support area formed at 0.75/0.7512 on Friday and instead found active bids nearby the 0.7520 neighborhood. With the higher timeframes indicating lower prices are likely on the cards, the supply base at 0.7571-0.7557 has been noted as a possible sell zone today given how well it held last week.
Our suggestions: Although the H4 zone essentially has the backing of higher-timeframe supplies, we would still highly recommend waiting for the H4 candles to show seller interest before pulling the trigger (a full-bodied bearish candle would be ideal). The first take-profit target, assuming a trade comes to fruition, would be the aforementioned H4 support zone.
Data points to consider: US PPI at 1.30pm GMT+1.
Levels to watch/live orders:
- Buys: Flat (stop loss: N/A).
- Sells: 0.7571-0.7557 ([waiting for a reasonably sized H4 bear candle – preferably a full-bodied candle – to form before pulling the trigger is advised] stop loss: ideally beyond the candle’s wick).
USD/JPY
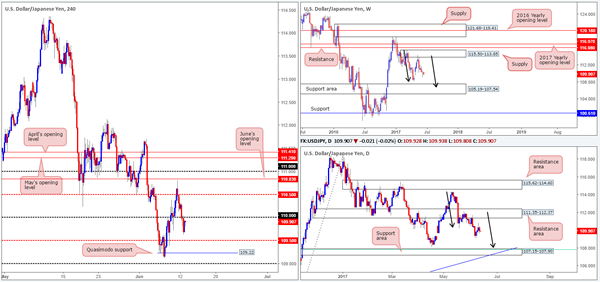
Weekly bears continue to remain in a relatively strong position after pushing aggressively lower from supply registered at 115.50-113.85. We know there’s a fair bit of ground to cover here, but this move could possibly result in further downside taking shape in the form of a weekly AB=CD correction (see black arrows) that terminates within a weekly support area marked at 105.19-107.54 (stretches all the way back to early 2014). In conjunction with weekly flow, daily price also shows a potential AB=CD correction in the works taken from the high 114.36, which could see price drive lower to 107.15-107.90: a support zone that’s glued to the top edge of the said weekly support area.
With the bigger picture in mind, the only thing we see of interest on the H4 timeframe at the moment is a short trade on any retest at the 110 handle.
Our suggestions: To prove seller interest around the 110 vicinity, however, we would advise waiting for a reasonably sized H4 bearish candle to take shape, preferably a full-bodied candle.
Data points to consider: US PPI at 1.30pm GMT+1.
Levels to watch/live orders:
- Buys: Flat (stop loss: N/A).
- Sells: 110 region ([waiting for a reasonably sized H4 bear candle – preferably a full-bodied candle – to form before pulling the trigger is advised] stop loss: ideally beyond the candle’s wick).
USD/CAD
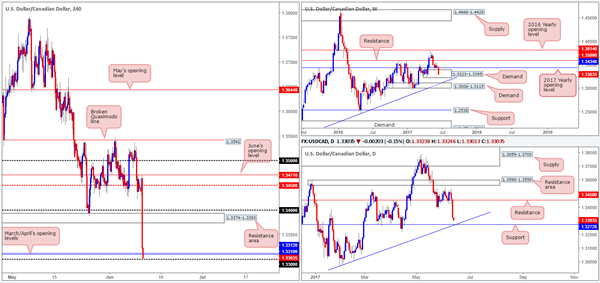
In recent hours, we’ve seen the USD/CAD plummet, with little to no reaction seen over in the oil market. At the time of writing, H4 price is trading around March/April’s opening levels at 1.3310/1.3312 and the 1.33 handle. Should the bears continue to push south, the next downside target in range is the H4 support base coming in at 1.3263. Located nearby is also a daily support level pegged at 1.3272 that intersects beautifully with a trendline support etched from the low 1.2968. Also of interest is the weekly demand at 1.3223-1.3395. Although the zone is under pressure at the moment, there’s still a chance, technically speaking, that bids will hold this area steady.
Our suggestions: Given the bearish momentum in play right now, we feel it will not be too long before the H4 support level mentioned above at 1.3263 is in view. With this line being positioned deep within the current weekly demand and being located so close to daily support at 1.3272, our team will be looking to buy this market from this region.
Data points to consider: US PPI at 1.30pm GMT+1.
Levels to watch/live orders:
- Buys: 1.3263 region ([waiting for a reasonably sized H4 bull candle – preferably a full-bodied candle – to form before pulling the trigger is advised] stop loss: ideally beyond the candle’s tail).
- Sells: Flat (Stop loss: N/A).
USD/CHF
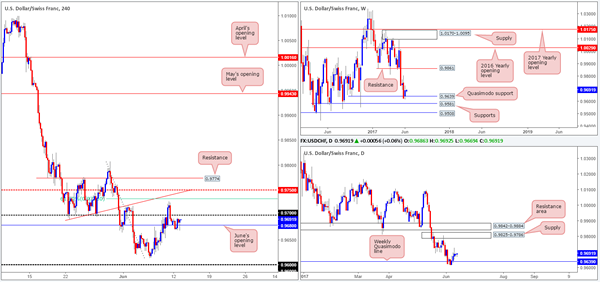
USD/CHF prices are effectively unchanged this morning, with the unit spending the majority of yesterday seesawing around June’s opening level at 0.9680. Before one can look ahead, however, there’s not only the nearby 0.97 handle to contend with, but also a H4 61.8% Fib resistance plugged at 0.9732, followed closely by the H4 mid-level resistance at 0.9750.
Having seen the weekly Quasimodo support level at 0.9639 hold steady, this could encourage further buying in this market, at least until we reach the daily supply pegged at 0.9825-0.9786.
Our suggestions: Despite the higher timeframes indicating that further buying may be at hand, the H4 chart, as we pointed out above, is just a minefield of resistances at the moment! Therefore, we have come to the conclusion that remaining on the sidelines may be the better bet for now.
Data points to consider: US PPI at 1.30pm GMT+1.
Levels to watch/live orders:
- Buys: Flat (stop loss: N/A).
- Sells: Flat (stop loss: N/A).
DOW 30
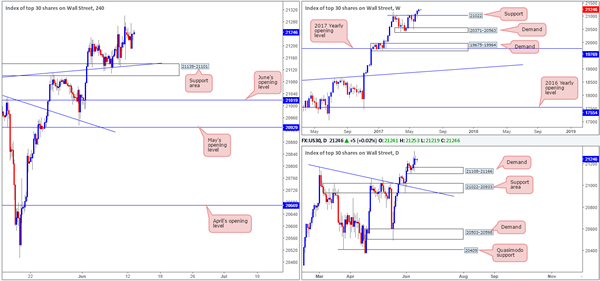
For those who have been following our reports over the past few days you may recall that our desk had recently taken a small long position at 21164 and placed stops below the H4 support area (21139-21101) at 21097. The position is still active, but we have liquidated 50% of the trade around the 21234 neighborhood. We have also reduced risk to breakeven and are now looking for the index to punch to fresh highs sometime this week.
Our suggestions: Essentially, what we’re looking for here is trend continuation. Given that there are no higher-timeframe resistances ahead, we’re looking to trail the remainder of our current position behind H4 supports. Once/if H4 price advances north, we will look to place stops below Monday’s session low (21192) at 21188.
Data points to consider: US PPI at 1.30pm GMT+1.
Levels to watch/live orders:
- Buys: 21164 ([live] stop loss: breakeven).
- Sells: Flat (stop loss: N/A).
GOLD
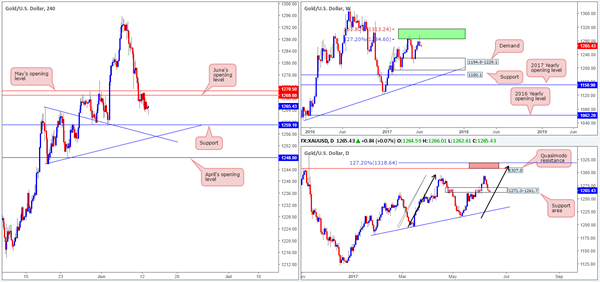
In current trading, June’s opening level at 1269.0, shadowed closely by May’s opening level at 1270.5, did a fantastic job of holding price lower during yesterday’s segment. The next area of interest seen below comes in at 1259.1: a support level that’s located relatively close to two H4 trendline supports (1245.8/1260.0).
Over on the bigger picture, nevertheless, bullion continued to drive lower from an area comprised of two weekly Fibonacci extensions 161.8/127.2% at 1313.7/1285.2 taken from the low 1188.1 (green zone) last week. Bouncing down to the daily timeframe, the support area at 1271.0-1261.7 was recently brought into the picture, and is just showing signs of bullish interest. Having seen this area cap upside nicely between mid-May right up until the end of June, this base is likely to offer support.
Our suggestions: This market is a challenge to trade at the moment with neither a long nor short looking attractive right now. The weekly picture indicates further selling could be upon us, while daily price is trading within a buy zone. All of this coupled with H4 price currently loitering between May and June’s opening levels and the said H4 support, makes this, at least for us, a difficult market to read at this time.
Levels to watch/live orders:
- Buys: Flat (stop loss: N/A).
- Sells: Flat (stop loss: N/A).