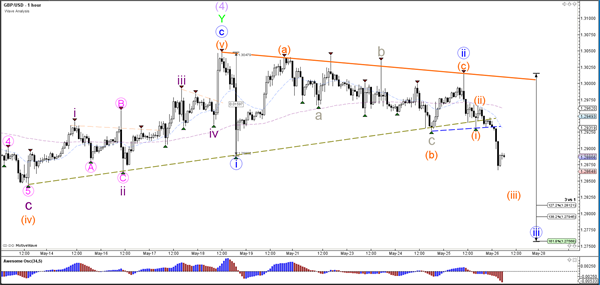
Currency pair GBP/USD
The GBP/USD broke the support trend line (dotted green) of the bullish channel, which could indicate a potential bearish reversal or correction. The Cable was unable to break above the 1.30 psychological round level.
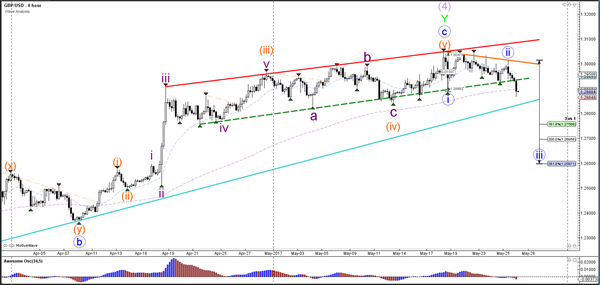
The GBP/USD showed a lengthy consolidation zone but broke below several key support levels (dotted lines). This bearish break could start a wave 3 (orange) which would become more likely if price managed to reach 1.2825. A wave could emerge once the wave 3 is confirmed and completed.
Currency pair EUR/USD
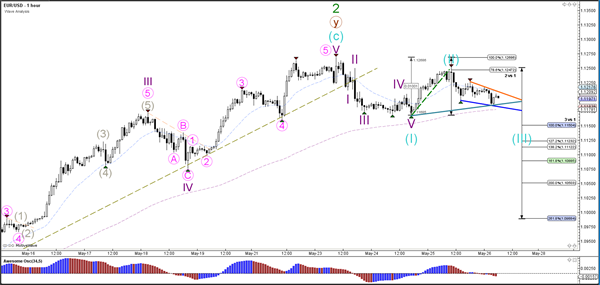
The EUR/USD failed to break above the 1.1250 resistance zone so far which is a major decision zone for either a bullish breakout or a bearish reversal. The critical level is the 100% Fibonacci at 1.1268: a break above this resistance top invalidates wave 2 (blue) whereas a break above 1.13 invalidates another bearish wave 2 (green). A bearish reversal, however, could see price break below support (blue).
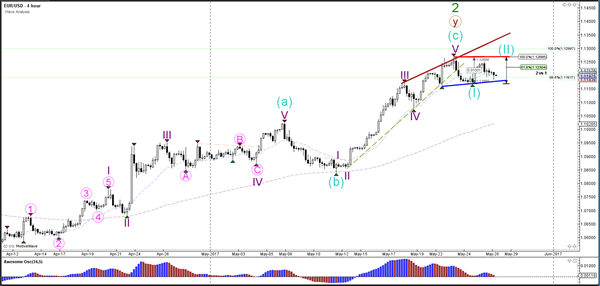
The EUR/USD respected and turn at the 78.6% Fibonacci resistance. Price will now need to show new direction by breaking support (blue) or resistance (orange).
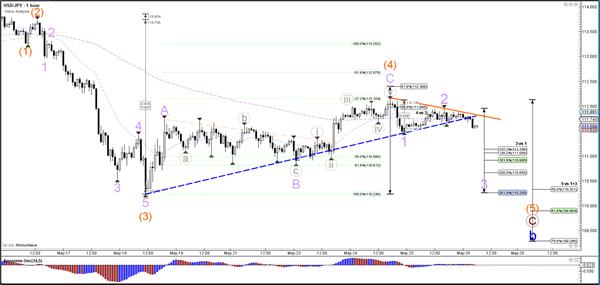
Currency pair USD/JPY
The USD/JPY is unable to break above the -27.2% Fibonacci target and could be building a bearish break (dotted blue) instead. Price will need to break below the support fractal (green) before a larger push could occur.
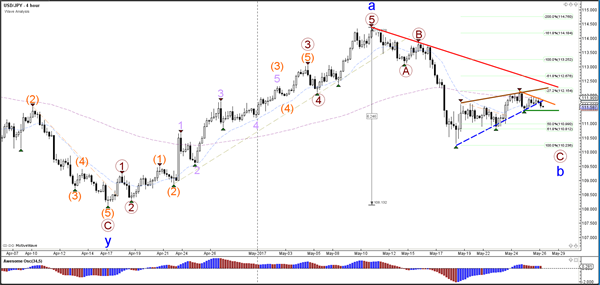
The USD/JPY is could be in wave 3 (purple) if price manages to reach the 161.8% Fibonacci target.