
A note on lower timeframe confirming price action…
Waiting for lower timeframe confirmation is our main tool to confirm strength within higher timeframe zones, and has really been the key to our trading success. It takes a little time to understand the subtle nuances, however, as each trade is never the same, but once you master the rhythm so to speak, you will be saved from countless unnecessary losing trades. The following is a list of what we look for:
- A break/retest of supply or demand dependent on which way you’re trading.
- A trendline break/retest.
- Buying/selling tails … essentially we look for a cluster of very obvious spikes off of lower timeframe support and resistance levels within the higher timeframe zone.
- Candlestick patterns. We tend to only stick with pin bars and engulfing bars as these have proven to be the most effective.
We typically search for lower-timeframe confirmation between the M15 and H1 timeframes, since most of our higher-timeframe areas begin with the H4. Stops are usually placed 1-3 pips beyond confirming structures.
EUR/USD
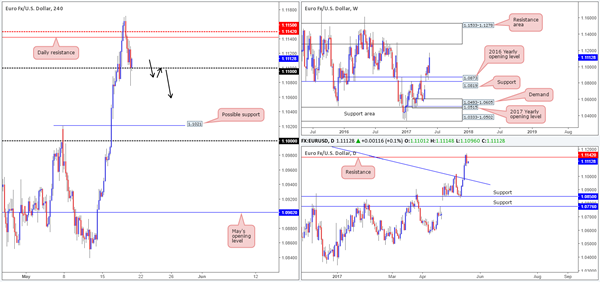
EUR/USD prices pulled back yesterday as the US dollar index continued to recover from lows of 97.33. This, as you can see, brought H4 action back down to the 1.11 handle, which, for the time being, is holding as support. Also notable from a technical perspective is the clear-cut bearish engulfing candle seen on the daily timeframe around resistance pegged at 1.1142. Up on the weekly timeframe, however, the pair shows little resistance until we reach the 1.1533-1.1278 range. With this in mind, we would need to see a decisive H4 close beyond the 1.11 barrier before looking to become sellers in this market, since this would, in effect, prove that the sellers are possibly interested in taking this market lower from the daily resistance.
Our suggestions: A decisive H4 close below 1.11 followed up with a retest and a reasonably sized H4 bearish candle, preferably a full-bodied candle, would be all the confirmation we’d need to short. The first take-profit target from this area would be the H4 support at 1.1021, followed closely by the large psychological level 1.10, which looks like it merges nicely with a daily trendline support etched from the high 1.1616.
Data points to consider: No high-impacting new events on the docket today.
Levels to watch/live orders:
- Buys: Flat (stop loss: N/A).
- Sells: Watch for H4 price to engulf 1.11 and then look to trade any retest of this number seen thereafter ([waiting for a H4 bearish candle to form following the retest is advised] stop loss ideally beyond the candle’s wick).
GBP/USD
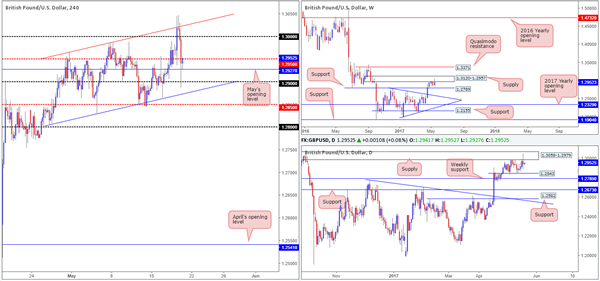
The impact of the better-than-expected UK retail sales figures on Thursday saw the GBP advance against its US counterpart, and aggressively take out the large psychological handle 1.30. As can be seen from the H4 chart, however, the pair failed to sustain gains beyond this number after connecting with the upside of a H4 channel resistance extended from the high 1.2965. The selloff from here was abrupt and saw price swiftly break back below 1.30 to challenge bids sitting around the 1.29 handle into the day’s close. Technically speaking, we were, as highlighted in Thursday’s report, expecting the market to turn lower given that we have a weekly supply in play at 1.3120-1.2957, which also happens to house a daily supply at 1.3058-1.2979 within. But, what we did not anticipate was the fakeout beyond 1.30!
Our suggestions: In view of the bigger picture, we would strongly advise against taking long positions in this market. Selling on the other hand, although backed by higher-timeframe structure, is also tricky. We have May’s opening level sitting a few pips below current price at 1.2927, followed closely by 1.29 and then the H4 channel support taken from the low 1.2804. This is just too restricted for our liking.
With the above in mind, our team has decided to ‘hang up the gloves’ today, and jump back into the action on Monday where structure will hopefully be a little more favorable.
Data points to consider: No high-impacting new events on the docket today.
Levels to watch/live orders:
- Buys: Flat (stop loss: N/A).
- Sells: Flat (stop loss: N/A).
AUD/USD
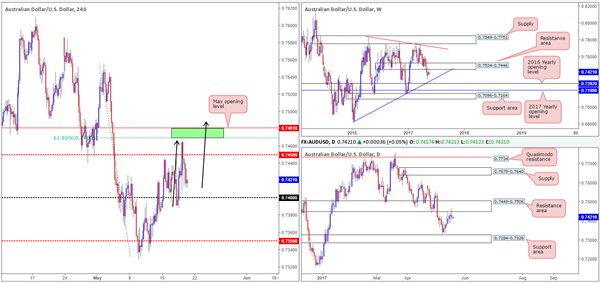
Early on in yesterday’s segment, we saw Aussie employment data print better-than-expected figures. This caused the AUD/USD to aggressively advance higher and eventually close above the H4 mid-level resistance barrier at 0.7450. As you can see, the pair came within a cat’s whisker of clipping the underside of May’s opening level at 0.7481/H4 61.8% Fib resistance at 0.7470 taken from the high 0.7556 (green zone) before turning lower. This was unfortunate as we were poised to short from this zone, as highlighted in Thursday’s report.
With the bigger picture showing weekly price retesting the underside of a resistance zone at 0.7524-0.7446 (has been in motion since mid-2016), and daily flow also seen retesting a resistance area seen within the weekly zone at 0.7449-0.7506, we feel sellers could potentially push this market much lower. Further supporting this, a daily selling wick printed yesterday, and the overall trend in this market is largely facing south.
Our suggestions: In light of the above, we’re looking for either of the following:
Price to rally and test our pre-determined H4 sell zone mentioned above in green. However, one should expect a fakeout of this zone in the event that this occurs. The reason for why simply comes down to the potential H4 AB=CD approach taken from the low 0.7388 (see black arrows).
Should we see a decisive close below the 0.74 handle, shorts on any retest seen at this number are an option, targeting the H4 mid-level support at 0.7350 as an initial take-profit target, followed by the top edge of a daily support area at 0.7326 (the next downside target on the daily timeframe).
Data points to consider: No high-impacting new events on the docket today.
Levels to watch/live orders:
- Buys: Flat (stop loss: N/A).
- Sells: 0.7481/0.7470 ([waiting for a reasonably sized H4 bear candle, preferably a full-bodied candle, to form before pulling the trigger is advised] stop loss: ideally beyond the candle’s wick). Watch for H4 price to engulf 0.74 and then look to trade any retest of this number seen thereafter ([waiting for a H4 bearish candle to form following the retest is advised] stop loss ideally beyond the candle’s wick).
USD/JPY
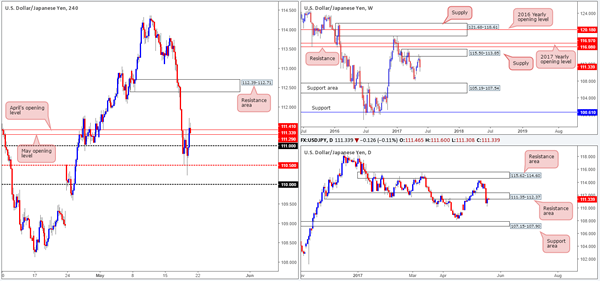
In recent sessions, we saw the US dollar recover from the H4 mid-level support at 110.50 and reach highs of 111.72 on the day. At the time of writing, the H4 candles are seen flirting with April/May’s opening levels at 111.41/111.29. Also of notable interest is the daily action which is currently seen retesting the underside of a resistance zone pegged at 111.35-112.37. This – coupled with weekly flow selling off from supply at 115.50-113.85, certainly places the bears in a strong position!
Our suggestions: The only grumble we have in regard to shorting from the two monthly levels is the 111 handle seen below which could act as support and halt selling. It is just too close for comfort! Therefore, similar to what we noted in Thursday’s report, we’d like to see a H4 bearish candle form from 111.41/111.29 that CLOSES below 111. This, for our team, would be a superb signal to short, targeting 110.50 as an initial take-profit area.
Data points to consider: No high-impacting new events on the docket today.
Levels to watch/live orders:
- Buys: Flat (stop loss: N/A).
- Sells: 111.41/111.29 region ([waiting for a reasonably sized H4 bear candle, preferably a full-bodied candle, to form that closes beyond 111 is advised] stop loss: ideally beyond the candle’s wick).
USD/CAD
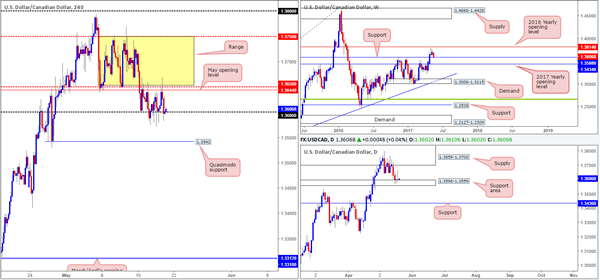
The USD/CAD, as you can see, is a tad messy at the moment. Since Monday, the pair has been chiseling out a consolidation between the 1.36 handle and May’s opening level at 1.3644, followed closely by the lower edge of the recent H4 range at 1.3650. Weekly price on the other hand remains trading around support at 1.3588, which happens to be housed within a daily support area coming in at 1.3598-1.3559. Therefore, trading short, even on a break below the current H4 range, would not be something we’d feel comfortable with.
Our suggestions: The next best option we have, in our opinion, is waiting for a decisive H4 close to form back above 1.3650 to confirm higher prices. Should this come to fruition and follow up with a retest at this number along with a reasonably sized H4 bull candle, preferably a full-bodied candle, we’d look to long this market, targeting the upper edge of the H4 consolidation sited at 1.3750.
Data points to consider: Canadian inflation data and Canadian retail sales figures scheduled for release at 1.30pm GMT+1.
Levels to watch/live orders:
- Buys: Watch for a H4 close above 1.3650 and then look to trade any retest of this number thereafter ([waiting for a reasonably sized H4 bull candle, preferably a full-bodied candle, to form following the retest before pulling the trigger is advised] stop loss: ideally beyond the candle’s tail).
- Sells: Flat (stop loss: N/A).
USD/CHF
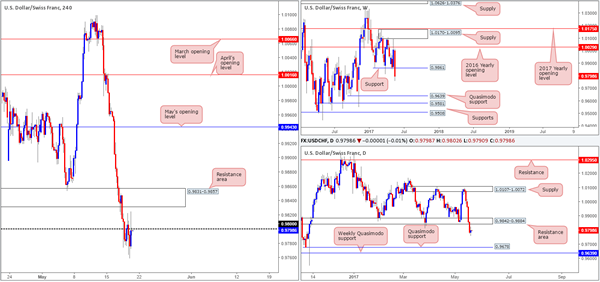
Kicking this morning’s report off with a look-see at the weekly timeframe, we can see that price continues to reflect a bearish stance below support at 0.9861.Providing that this continues to be seen, the next downside target in view is 0.9639: a Quasimodo support level. Sliding down to the daily timeframe, the support area at 0.9842-0.9884, which happens to hold the weekly support level mentioned above within, was taken out on Wednesday. In our estimation, this has placed the daily Quasimodo support at 0.9678 in view, followed closely by the above noted weekly Quasimodo support.
Our suggestions: Given that downside is clearly favored at the moment, we still have our eye on trading any retest seen at 0.98. What we’re ideally looking for here is a reasonably sized H4 bearish candle to print off this number (preferably a full-bodied candle), This would, in our opinion, be enough evidence to short, targeting the 0.97 handle, which sits just above the said daily/weekly Quasimodo support levels.
Data points to consider: No high-impacting new events on the docket today.
Levels to watch/live orders:
- Buys: Flat (stop loss: N/A).
- Sells: 0.98 region ([waiting for a reasonably sized H4 bear candle, preferably a full-bodied candle, to form before pulling the trigger is advised] stop loss: ideally beyond the candle’s wick).
DOW 30
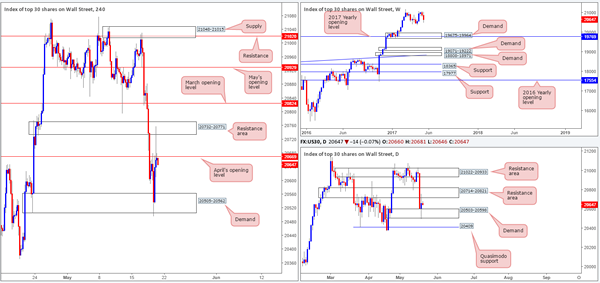
Going into the early hours of yesterday’s London segment US stocks recovered from H4 demand at 20505-20562 after aggressively selling off on Wednesday. The advance from this zone saw price whipsaw through April’s opening level at 20669 and shake hands with a resistance area coming in at 20732-20771 going into the closing bell. According to H4 structure, lower prices could be on the cards, at least until we reach the above said H4 demand base. Over on the daily timeframe, however, the index is currently capped between a resistance area pegged at 20714-20821 and a demand zone penciled in at 20503-20598.
Our suggestions: Although H4 structure shows space to move lower, let’s keep in mind that the top edge of the daily support zone mentioned above at 20598 is trading nearby current price, and as such could halt further selling. From our perspective, price action appears far too restricted to trade at the moment. Yes, you could try and squeeze out a short from April’s opening level, but is it really worth it knowing a daily support zone is lurking just below?
Data points to consider: No high-impacting new events on the docket today.
Levels to watch/live orders:
- Buys: Flat (stop loss: N/A).
- Sells: Flat (stop loss: N/A).
GOLD
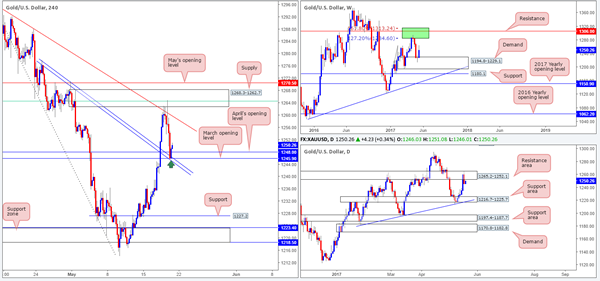
With the US dollar entering into recovery mode yesterday, the price of gold declined. Before this happened though, the unit beautifully tapped the underside of a H4 61.8% Fib resistance at 1264.5 (green line) extended from the high 1295.4. This line – coupled with a H4 supply barrier coming in at 1268.3-1262.7 and a H4 trendline resistance (again) taken from the high 1295.4 was, as highlighted in Thursday’s report, a zone to watch for selling opportunities. Well done to any of our readers who managed to net some green pips here! The selloff brought the yellow metal down to the take-profit target, another interesting place on the H4 chart: March/April’s opening levels at 1245.9/1248.0, which happens to merge beautifully with a H4 trendline support etched from the high 1278.0.
Our suggestions: Buying from 1245.9/1248.0 is tempting given the trendline confluence and the fact that weekly price recently traded from demand at 1194.8-1229.1 and shows room to advance. However, one might want to take into account that daily action resides around the underside of a resistance zone marked at 1265.2-1252.1 which could, of course, halt buying. Despite this, the recently closed H4 candle printed off 1245.9/1248 was strong, in our opinion. This, along with all the other noted points suggesting that the bulls may take control, was enough for our team to buy at 1249.2, with a stop positioned just below at 1244.9. Our take-profit target is currently set around the underside of the said H4 trendline resistance.
Levels to watch/live orders:
- Buys: 1249.2 ([live] stop loss: 1244.9).
- Sells: Flat (stop loss: N/A).