EUR/USD
EUR/USD’s rally extended to fresh 2017 highs this Tuesday, fueled intraday by another batch of soft US data and the scandal surrounding US President Trump, involving classified information being unveiled to Russian diplomats. The news came after Trump fired FBI’s director, James Comey, on the back of Russia supposed involvement in the latest election, fueling political unrest in the world’s largest economy. Greenback’s slide was uneven across the board, yet that the currency is being dropped by investors, is undeniable.
Macroeconomic data released at both shores of the Atlantic backed the rally, as in the EU, preliminary Q1 GDP matched expectations, with economic growth advancing 0.5% in the three months to March, whilst German ZEW survey showed that local business confidence continued to improve in May, although less than market’s forecast. The index rose to 20.6 from 19.5 points in the previous month, missing expectations of a rise to 22.0. In the US, housing data surprised to the downside, with building permits down to 1.229M from previous 1.26M, and housing starts also down in April, accounting for 1.172M vs. previous 1.203M. Industrial output, however, improved, up in April by 1.0%, the fastest rate in more than three years.
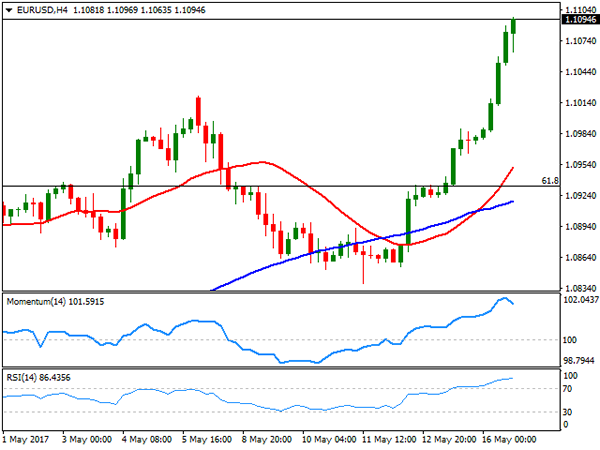
From a technical point of view, the pair has reached extreme overbought conditions in the short term, but with the price pressuring the daily high, betting on a decline seems too risky. In the 4 hours chart, technical indicators have barely retreated from extreme readings, with the RSI indicator standing at 85, whilst the price accelerated further beyond a bullish 20 SMA. The rally could meet some profit taking on an initial approach to the 1.1100 figure, yet further gains can be expected, as long as the pair holds now above the 1.1000 critical figure.
Support levels: 1.1045 1.1000 1.0965
Resistance levels: 1.1130 1.1180 1.1220
USD/JPY
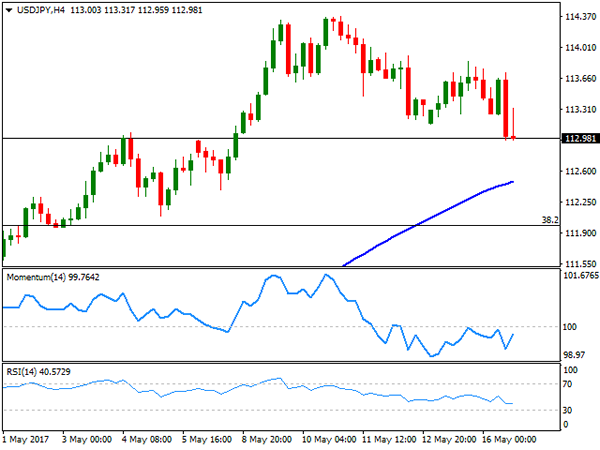
The USD/JPY pair fell to a fresh 2-week low of 112.96, undermined in the US afternoon by a decline in US yields, which remain a driving force for the safe-haven currency. Treasury yields have been stable for most of the week, but fell in the latest hour following an auction. The 10-year benchmark now stands at 2.33%, down from previous 2.34%, while the 30-year yield retreated to 2.99% from 3.01%. Comments from BOJ’s Governor Kuroda confident stance on withdrawing stimulus in the future, is also yen supportive, as the Central Bank’s leader said earlier today that he is "quite sure" that they can smoothly exit monetary stimulus when the time comes. Entering the Asian session barely holding around 113.00, the pair has an immediate support around 112.50, where in the 4 hours chart stands a bullish 100 SMA, followed by 112.00, the 38.2% retracement of the November/December rally. In the same chart, the RSI indicator aims higher within negative territory, but the RSI indicator anticipates some further declines, heading south around 40.
Support levels: 113.20 112.75 112.40
Resistance levels: 114.00 114.50 114.85
GBP/USD
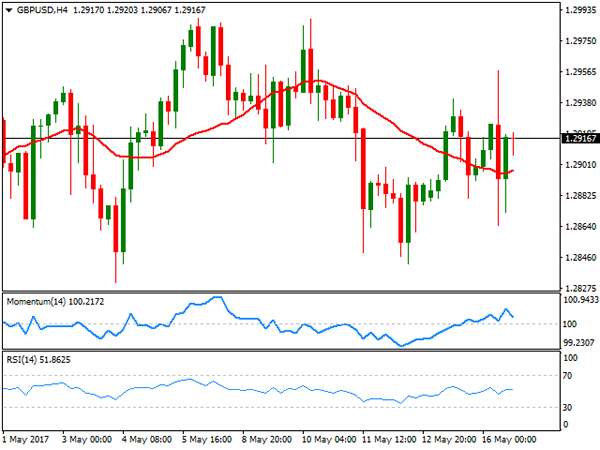
The British Pound failed to gather momentum from higher-than-expected April inflation figures, ending the day anyway with modest gains at 1.2917. UK inflation surpassed market’s consensus in beyond, printing a whopping 2.7% yearly basis, above the 2.6% expected and previous 2.3%. When compared to the previous month, inflation advanced 0.5%, surpassing the 0.4% forecast. Producer prices inflation was also higher than expected, with factory output prices up by 0.5% in the same month, and by 3.6% yearly basis, matching previous month’s figures, but above the 3.4% expected. Higher inflation usually means that the BOE would be a step closer to rising rates, triggering a rally in the GBP, but uncertainty surrounding the Brexit and the upcoming elections maintained investors side-lined this time. The pair has traded as high as 1.2957 and as low as 1.2865, with the daily candle presenting a limited body, a sign of the uncertainty surrounding the pair. Short term, the pair retains the neutral stance seen on previous updates, as in the 4 hours chart, technical indicators keep hovering around their mid-lines with no certain directional strength, whilst the price settled a few pips above a modestly bearish 20 SMA.
Support levels: 1.2900 1.2865 1.2830
Resistance levels: 1.2960 1.2995 1.3040
GOLD
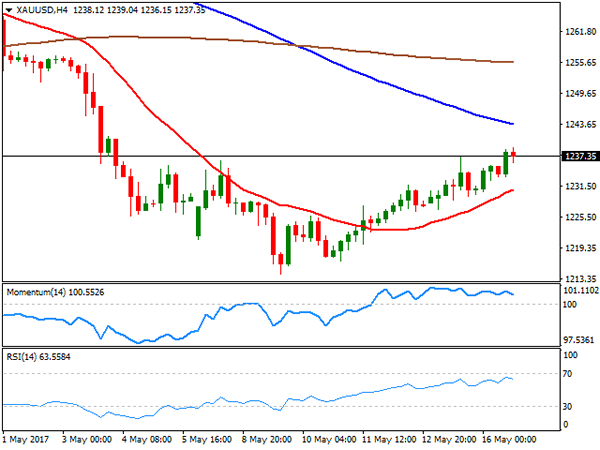
Stop gold settled at $1,237.50 a troy ounce, extending its weekly advance by a few cents as the greenback remains in sell mode, while market’s mood remains high. The bright metal has posted a limited recovery ever since bottoming at a two-month low of 1,214.24 earlier this month, as odds for a US rate hike next June limit chances of a steeper advance. From a technical point of view, the pair has pared its advance right below a horizontal 100 DMA, but advanced above its 200 DMA for the first time in over a week, while it remains below a strongly bearish 20 DMA, this last at 1,243.30. Technical indicators in the mentioned time frame remain within negative territory, with the RSI heading higher around 45, but the Momentum showing no certain directional strength. In the 4 hours chart, a positive tone prevails, with the price above a bullish 20 SMA, and indicators presenting a neutral-to-bullish stance within positive territory.
Support levels: 1,233.20 1.226.60 1,214.25
Resistance levels: 1,243.30 1,251.30 1,262.10
WTI CRUDE OIL
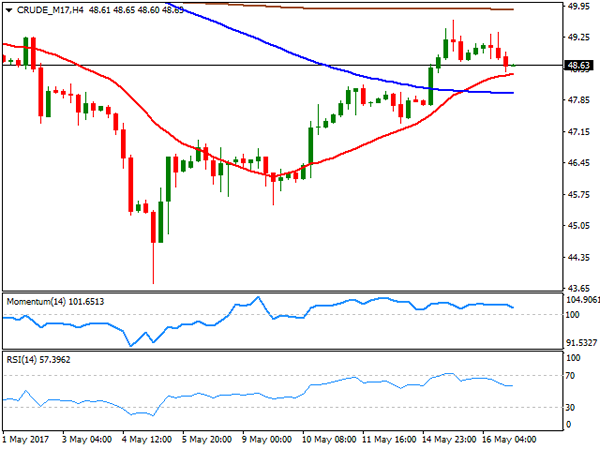
Crude oil prices retreated this Tuesday, with West Texas Intermediate crude futures settling at $48.63 a troy ounce. Despite broad dollar’s weakness, the commodity was unable to extend its upward momentum, as investors turned cautious ahead of the weekly US stockpiles release. Inventories are expected to have decreased by around 2.3 million barrels in the week ended May 12th. The API report to be released at the beginning of the Asian session, may hint what the EIA will bring later on the day. From a technical point of view, the daily cart shows that the price remained within the higher end of Monday’s range and above a modestly bearish 20 DMA, but also that technical indicators have lost their upward momentum and turned flat within neutral territory. Shorter term and according to the 4 hours chart, technical indicators have eased within positive territory, with the price resting a few cents above a bullish 20 SMA, providing an immediate support at 48.45.
Support levels: 48.45 47.30 46.60
Resistance levels: 48.95 49.60 50.10
DJIA
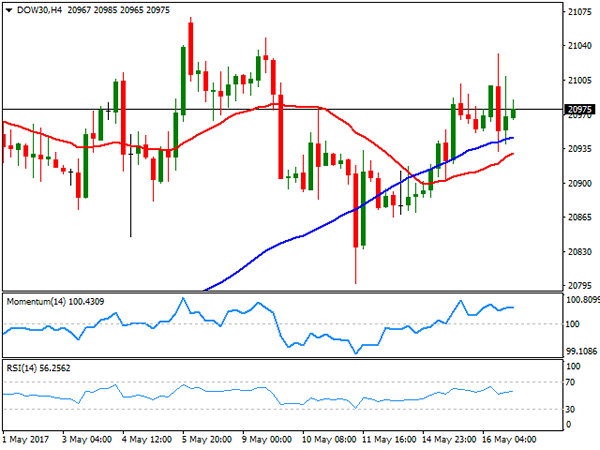
Wall Street closed mixed, with the Nasdaq Composite ending the day 20 points higher at 6,169.87, but the Dow and the S&P trimming all of its daily gains ahead of the close, both ending the day with marginal losses. The DJIA shed 2 points, to 20,979.68, while the S&P lost 0.07% and ended at 2,400.67. Techs were the best performers, with Microsoft leading winners’ list within the Dow, up 2.01% and followed by IBM which added 1.43%. UnitedHealth Group was the worst performer, down 1.99% while Nike shed 1.84%. From a technical point of view, the index maintains a neutral stance, as investors stand clueless on political woes, although confident on a brighter future. In the daily chart, technical indicators stand pat around their mid-lines, whilst the index barely ended a couple of points above a modestly bullish 20 DMA. In the 4 hours chart, the technical picture is neutral-to-bullish as indicators hold flat within positive territory, whilst intraday declines were contained by a bullish 100 SMA, currently at 20,945.
Support levels: 20,865 20,822 20,797
Resistance levels: 20,900 20,941 20,977
FTSE100
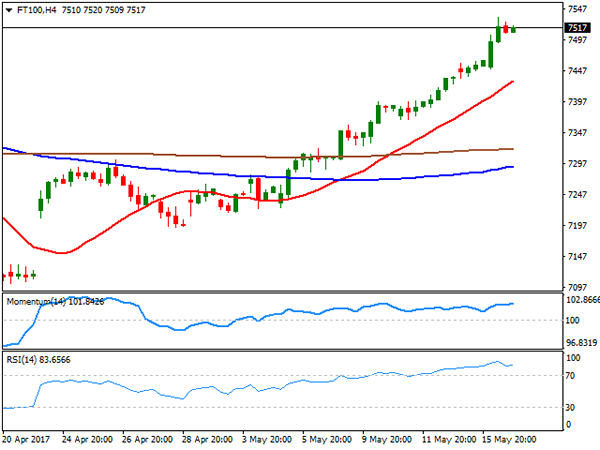
The FTSE 100 rallied to fresh record highs, adding 68 points at the end of the day to settle at 7,522.03. Advancing mining-related equities alongside with a soft Pound, supported once again the advance in the Footsie. Vodafone was the best performer after the telecoms group raised its forecasts for profits for the coming year, posting a 3.96% intraday gain. Fresnillo followed through with a 2.90% advance, whilst Rio Tinto added 2.68%. Hargreaves Lansdown plunged 8.50% leading losers list after competitor Vanguard announced plans to launch an online service to sell its funds directly to UK investors, spurring concerns over an upcoming price war. EasyJet followed, down by 7.25% after reporting a £212 million loss for the first half of its financial year. The index holds around the mentioned close early Asia, and the daily chart shows that the RSI indicator maintains its upward slope at 71, while the Momentum indicator resumed its advance after a modest downward correction, indicating that further gains are likely, despite a downward corrective move can’t be dismissed. In the 4 hours chart, technical indicators are also biased higher within extreme overbought territory, as the 20 SMA keeps advancing far above the larger ones and below the current level.
Support levels: 7,508 7,465 7,410
Resistance levels: 7,535 7,570 7,600
DAX
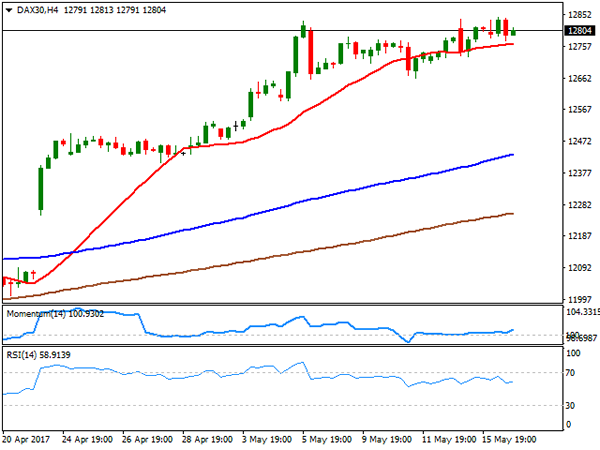
European equities closed mixed around their opening levels, with the German DAX pretty much unchanged, down 2 points to 12,979.53, weighed by a decline in the automotive sector. In Germany, confidence remained strong, but the positive sentiment has grown at a slower-than-expected pace, denting local sentiment, alongside with a non-motivating EU Q1 GDP. Only nine components managed to advance, with ThyssenKrupp adding 4.03%, followed by Deutsche Telekom that gained 1.08%. The worst performer was Linde, down 1.22% followed by BASF that closed -1.09%. The index closed the day with a small doji, having held within the upper end of Monday’s range, overall retaining the positive stance, as in the daily chart, the RSI indicator continues consolidating in overbought levels, whilst the Momentum indicator turned flat above its 100 line as moving averages keep advancing well below the current level. In the 4 hours chart, a modest positive tone is present, as indicators bounced from their mid-lines, while the index holds above its 20 SMA.
Support levels: 12,801 12,755 12,718
Resistance levels: 12,839 12,870 12,920