
A note on lower timeframe confirming price action…
Waiting for lower timeframe confirmation is our main tool to confirm strength within higher timeframe zones, and has really been the key to our trading success. It takes a little time to understand the subtle nuances, however, as each trade is never the same, but once you master the rhythm so to speak, you will be saved from countless unnecessary losing trades. The following is a list of what we look for:
- A break/retest of supply or demand dependent on which way you’re trading.
- A trendline break/retest.
- Buying/selling tails … essentially we look for a cluster of very obvious spikes off of lower timeframe support and resistance levels within the higher timeframe zone.
- Candlestick patterns. We tend to only stick with pin bars and engulfing bars as these have proven to be the most effective.
EUR/USD
Weekly gain/loss: – 67 pips
Weekly closing price: 1.0931
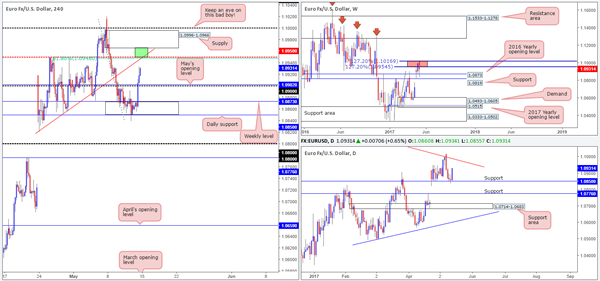
The previous week’s action saw the single currency dive lower from 1.1016/1.0954 (red zone), which is made up of two weekly 127.2% Fib extensions taken from the lows 1.0340/1.0493.As you can see though, it was not smooth sailing for the bears as the 2016 yearly opening level at 1.0873 elbowed its way into the spotlight, consequently erasing around 50% of the week’s losses.
As can be seen from the daily chart, support at 1.0850 also played a huge role in last week’s bullish recovery! The week ended with the pair printing a near-full-bodied bullish close which could point towards further upside this week back up to the trendline resistance extended from the high 1.1616.
A strong decline in the US dollar sparked by lower-than-expected US Inflation data and Retail sales figures on Friday helped lift H4 price out from within 1.0850/1.0873 (the combined daily support and weekly 2016 yearly opening level). Well done to any of our readers who managed to jump aboard this move as it was a noted zone to look for buying opportunities from! With price seen concluding the week looking as though it wants to grapple with the mid-level resistance at 1.0950, where does one go from here?
Our suggestions: 1.0950 is a reasonably attractive neighborhood for shorts due to the following confluence:
A H4 trendline resistance taken from the low 1.0820.
A H4 61.8% Fib resistance pegged at exactly 1.0950.
A H4 supply base at 1.0996-1.0966.
The 127.2% weekly Fib extension is seen at 1.0954.
Therefore, there’s a chance we may see a bounce from our small green box at 1.0966/1.0950 this morning. As tempting as it may be to place pending sell orders here, however, we’d strongly advise against this. Our reasoning stems from seeing 1.1000 lurking just above. This large psychological line not only sits within the upper limits of the weekly Fib ext. zone (see above), it also converges closely with the said daily trendline resistance! For that reason, waiting for a reasonably sized H4 bearish rotation candle to form within the noted green zone (preferably a full-bodied candle) is recommended.
So, with the above taken on board, we have two areas to keep an eyeball on this morning:
The above noted green area which comprises of attractive confluence.
If the 1.0950 region fails to hold, 1.1000 will likely be the next barrier on the hit list!
Data points to consider: No high-impacting news events on the docket today.
Levels to watch/live orders:
- Buys: Flat (stop loss: N/A).
- Sells: 1.0966/1.0950 ([waiting for a reasonably sized H4 bear candle, preferably a full-bodied candle, to form before pulling the trigger is advised] stop loss: ideally beyond the candle’s wick). 1.1000 (stop loss: 1.1020).
GBP/USD
Weekly gain/loss: – 94 pips
Weekly closing price: 1.2882
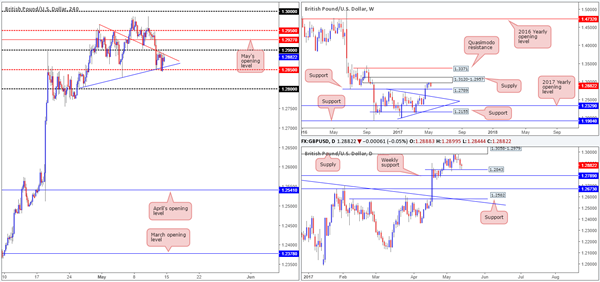
After spending a week or so lingering around the underside of a weekly supply zone coming in at 1.3120-1.2957, the bears decided to join the party last week. Breaking a four-week bullish phase, this has brought the weekly support line at 1.2789 back into view, and could, given its history, potentially halt further selling this week. So do make sure to keep note of this line, traders!
In saying that though, as we slide down to the daily timeframe, there’s immediate support seen nearby around the 1.2843 region. Also of interest here is the reasonably attractive buying tail printed on Friday, which could signify that the bulls may come into the market sooner than we initially thought.
A brief look at recent dealings on the H4 chart reveals that the candles remain in a somewhat restricted state. Not only is the unit confined between the mid-level support at 1.2850 and the1.29 handle, there’s also two converging trendlines to contend with (1.2804/1.2965).
Our suggestions: We still believe downside is the more favored route this morning, given the weekly supply currently in play and also with May’s opening level sitting directly above 1.29 at 1.2927 further restricting upside. At the time of writing, our team’s focus is on looking for a decisive H4 close beyond 1.2850/H4 trendline support. A close beyond this angle, followed with a retest as well as a lower-timeframe sell signal (see the top of this report for ideas on how to use the lower timeframes for entry) would, in our opinion, be enough confirmation to sell (intraday), targeting the 1.28 neighborhood (sits just above the aforementioned weekly support level).
Data points to consider: No high-impacting news events on the docket today.
Levels to watch/live orders:
- Buys: Flat (stop loss: N/A).
- Sells: Watch for H4 price to engulf 1.2850 and then look to trade any retest seen thereafter ([waiting for a lower-timeframe sell signal to form following the retest is advised] stop loss: dependent on where one confirms this level).
AUD/USD
Weekly gain/loss: – 29 pips
Weekly closing price: 0.7385
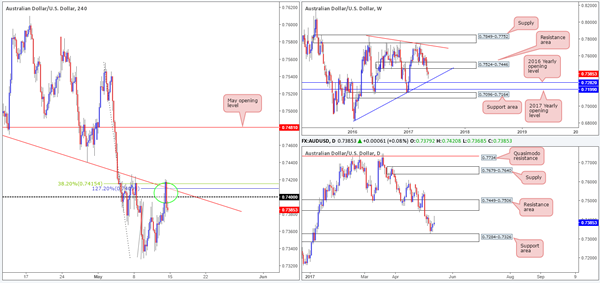
The AUD/USD sustained further losses last week, bringing price down to within close proximity of a weekly trendline support extended from the low 0.6827/2016 yearly opening level at 0.7282. The week, however, concluded forming a moderately sized weekly buying tail, which could portend a retest at the weekly resistance area drawn from 0.7524-0.7446.
The story on the daily chart, nonetheless, shows price came within a cat’s whisker of connecting with the support zone at 0.7284-0.7326 on Tuesday, and rallied higher. Be that as it may, the week did conclude with price chalking up a beautiful-looking selling wick, highlighting the possibility that shorts may come into the picture today/early this week.
For those who read Friday’s report you may recall that our team underlined the likelihood of shorts coming into the market between 0.7415/0.74. The area comprised of the following: a 0.74 handle, a H4 trendline resistance extended from the low 0.7475, an AB=CD 127.2% H4 Fib ext. at 0.7409 taken from the low 0.7328 and a 38.2% H4 Fib resistance at 0.7415 pegged from the high 0.7556. As you can see, price slightly surpassed our sell zone, but held firm overall.
Our suggestions: In view of the daily selling wick and recent interaction with a highly confluent H4 sell zone, our team believes further selling may be on the cards, despite the weekly buying tail. With that being the case, we’re going to be watching for price to retest 0.7415/0.74 this week. This – coupled with a H4 bearish rotation candle, preferably a full-bodied candle, would be enough evidence, in our view, to short from here, targeting the said daily support area.
Data points to consider: Chinese Industrial production figures at 3am GMT+1.
Levels to watch/live orders:
- Buys: Flat (stop loss: N/A).
- Sells: 0.7415/0.74 ([waiting for a reasonably sized H4 bear candle, preferably a full-bodied candle, to form before pulling the trigger is advised] stop loss: ideally beyond the candle’s wick).
USD/JPY
Weekly gain/loss: + 70 pips
Weekly closing price: 113.33
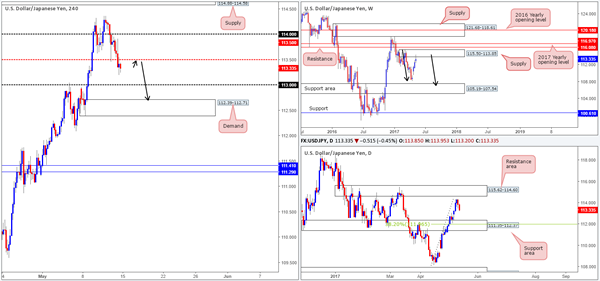
The USD/JPY market enjoyed another relatively successful week, with the latest advance marking the fourth consecutive weekly bullish close. For all that though, weekly supply at 115.50-113.85 did a superb job in holding back the buyers last week, consequently forming a rather strong-looking selling wick. We know there’s a lot of ground to cover, but this rejection could be the beginnings of a downward move in the form of a weekly AB=CD correction (see black arrows) into the weekly support area marked at 105.19-107.54.
Leaving the daily resistance area at 115.62-114.60 unchallenged last week, an area seen lodged around the upper edge of the said weekly supply, price turned lower and now looks to be heading in the direction of a daily support area drawn in at 111.35-112.37. Also of particular interest here is that this area holds a 38.2% Fib support at 111.96 marked from the low 108.13.
Since late Wednesday, after striking a high of 114.36, the H4 candles have been receding lower. This downside momentum was intensified on Friday following lower-than-expected US Inflation data and Retail sales figures. With the unit ending the week breaking below and retesting the underside of the mid-level number 113.50, we see little stopping price from reaching out and testing the 113 handle today.
Our suggestions: Knowing that weekly sellers are likely in play right now; would you want to be long at 113? We for sure would not! Instead of looking to buy from here, we’re actually looking for price to retest 113.50 for a second time for a possible shorting opportunity. Should this come to fruition, we’d move stops to break even upon connecting with 113, but not look to take partial profits until we meet with H4 demand at 112.39-112.71. 113 is extremely vulnerable, in our opinion, due to the fact that weekly sellers will likely be pushing this market lower this week.
Data points to consider: No high-impacting news events on the docket today.
Levels to watch/live orders:
- Buys: Flat (stop loss: N/A).
- Sells: 113.50 reigon ([waiting for a reasonably sized H4 bear candle, preferably a full-bodied candle, to form before pulling the trigger is advised] stop loss: ideally beyond the candle’s wick).
USD/CAD:
Weekly gain/loss: + 61 pips
Weekly closing price: 1.3708
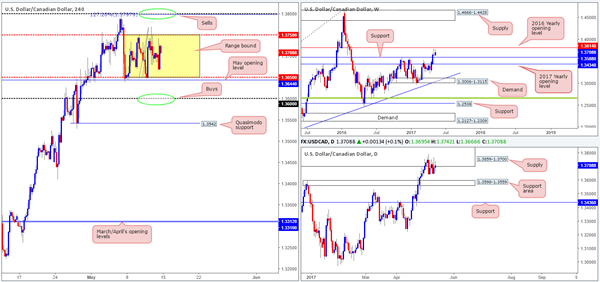
Over the course of the last two weeks, the weekly candles have been sandwiched between the 2016 yearly opening level seen at 1.3814 and support chiseled in at 1.3588, leaving upside momentum somewhat weakened. A violation of 1.3814 could lead to a colossal move up to supply drawn from 1.4666-1.4428. Yet, a move seen below the current support, however, would place the 2017 yearly opening base line at 1.3434 on the radar.
Down to the daily timeframe, price action is a tad messy as the unit seesaws around the underside of supply coming in at 1.3859-1.3700, which holds the said 2016 yearly opening level within. The next downside target in view is a support zone formed at 1.3598-1.3559 that houses the current weekly support level.
Since the beginning of the week, the USD/CAD has been seen consolidating between 1.3750/1.3650. Beneath this range is a round number seen at 1.36, which happens to sit two pips above the daily support area at 1.3598-1.3559 (the next downside target on the daily scale). Above, however, sits the 1.38 handle. This level is attention-grabbing due to it being positioned just below the 2016 yearly opening level seen on the weekly chart at 1.3814, and also seeing as how it connects with a H4 AB=CD 127.2% ext. marked at 1.3797(taken from the low 1.3647).
Our suggestions: Of course, the current H4 range is an area that could be traded and may very well work out beautifully.
With that being said though, given our conservative nature, we would not be looking to sell this piece until price has connected with the above noted 2016 yearly opening level (essentially around the 1.38 region seen circled in green on the H4 chart). The reason being, apart from the merging confluence with the H4 127.2% ext. and weekly 2016 yearly opening level, is that this line is firmly located within the upper limits of the said daily supply and thus allows the trader to conservatively place stops above this area.
Also of note is the 1.36 handle. Boasting a daily support zone positioned a few pips below at 1.3598-1.3559 (houses a weekly support at 1.3588) 1.36, in our opinion, is worthy of attention.
Data points to consider: No high-impacting news events on the docket today.
Levels to watch/live orders:
- Buys: 1.36 region is a worthy place for longs which requires no additional confirmation (stop loss: conservative at 1.3557).
- Sells: 1.3814/1.38 region is an ideal place for shorts as we believe this area requires no additional confirmation (stop loss: conservative at 1.3861).
USD/CHF
Weekly gain/loss: + 210 pips
Weekly closing price: 1.0081
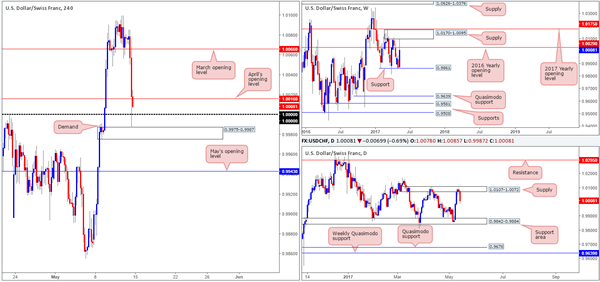
After crossing swords with the weekly support level at 0.9861 two weeks back, a strong succession of bids flooded the market last week. Despite price failing to sustain gains beyond the 2016 yearly opening level at 1.0029 after touching gloves with a weekly supply zone at 1.0170-1.0095, the pair still ended the week strongly!
Winding down to the daily chart, we can see that since the 27th March the Swissy has been capped by a supply base drawn from 1.0107-1.0072 (glued to the underside of the aforementioned weekly supply) and a daily support area coming in at 0.9842-0.9884 (houses the said weekly support level). Last week’s rejection from the noted supply base is a testament to this consolidation.
The aftermath of Friday’s disappointing US Inflation data and Retail sales figures drove the pair southbound. Several H4 tech supports were wiped out during the onslaught, with price stabilizing only after whipsawing through parity (1.0000) and testing H4 demand penciled in at 0.9975-0.9987
Our suggestions: While both the weekly and daily charts indicate further selling could be upon us, we cannot justify shorting into both 1.0000 and the noted H4 demand. It would take a decisive H4 close beyond these barriers to confirm bearish intent down to May’s opening line at 0.9943.
So, with that in mind, longs are out of the question given the bigger picture, and shorts are only considered (our opinion) to be valid on a H4 close beyond the noted H4 demand.
Data points to consider: No high-impacting news events on the docket today.
Levels to watch/live orders:
- Buys: Flat (stop loss: N/A).
- Sells: Watch for H4 price to engulf demand at 0.9975-0.9987 and then look to trade any retest seen thereafter ([waiting for a reasonably sized H4 bearish candle to form following the retest is advised, preferably in the shape of a full-bodied candle] stop loss: ideally beyond the candle’s wick).
DOW 30
Weekly gain/loss: – 138 points
Weekly closing price: 20885
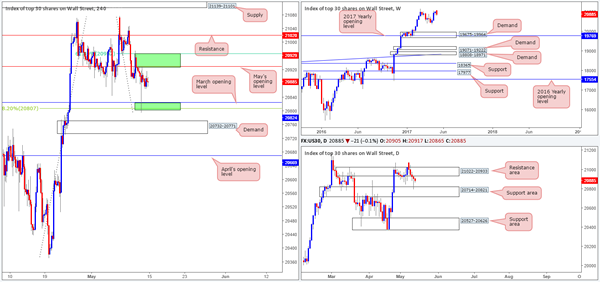
Following three consecutive weekly gains, weekly action chalked up nice-looking bearish engulfing candle last week not too far from record highs at 21170. Whether this will amount to further selling is difficult to forecast as so far this year, the index has recorded healthy gains.
Looking at the daily chart, it’s clear to see that there was not a single bullish day recorded last week, even though price connected with a support area pegged at 20714-20821. The resistance area seen above at 21022-20933, in our opinion, looks worn out, as twice we’ve seen the unit surpass its upper boundaries. However, should the bears continue to drive lower this week and take out the current support zone, the next hurdle on the radar falls in at 20527-20626.
Bouncing across to the H4 chart, we can see that movement is currently restricted by May’s opening level at 20929 and March’s opening base line drawn in at 20824. May’s level is, as you can see, bolstered by a 61.8% H4 Fib resistance at 20967 (upper green zone) taken from the high 21078, and March’s level closely converges with a 38.2% H4 Fib support at 20807 drawn from the low 20371 (lower green zone).
Our suggestions: To our way of seeing things, there’s equal opportunity to trade this market both long and short, as both green zones highlight confluence from both H4 and daily structures (see above). To play on the safe side though, both H4 zones require a reasonably sized H4 rotation candle (preferably a full-bodied candle) before we’d look to commit since a fakeout through these areas are highly likely to be seen.
Data points to consider: No high-impacting news events on the docket today.
Levels to watch/live orders:
- Buys: 20807/20824 ([waiting for a reasonably sized H4 bull candle, preferably a full-bodied candle, to form before pulling the trigger is advised] stop loss: ideally beyond the candle’s tail).
- Sells: 20967/20929 ([waiting for a reasonably sized H4 bear candle, preferably a full-bodied candle, to form before pulling the trigger is advised] stop loss: ideally beyond the candle’s wick).
GOLD
Weekly gain/loss: Little change
Weekly closing price: 1228.0
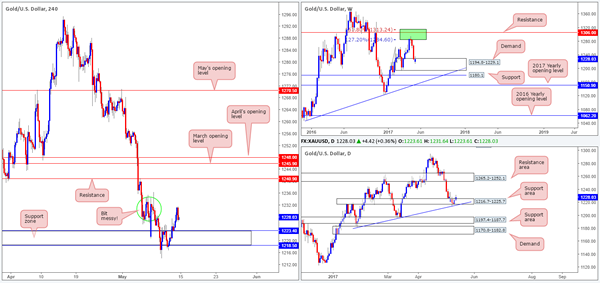
After the yellow metal drove into the walls of weekly demand at 1194.8-1229.1 two weeks ago, the bulls have registered some interest here last week. In the event that this area continues to be respected and price rallies, there’s a good chance that the market could retest the two weekly Fibonacci extensions 161.8/127.2% at 1313.7/1285.2 taken from the low 1188.1 (green zone).
Bolstering the current weekly demand is a daily support area at 1216.7-1225.7 (strengthened by a trendline support extended from the low 1180.4). The next upside hurdle from this angle can be seen around a resistance area pegged at 1265.2-1252.1.
Although the H4 candles are showing strength from the support zone at 1218.5-1223.4, intensified by Friday’s disappointing US Inflation data and Retail sales figures, there’s still an awful amount of wood to chop through seen marked with a green circle at 1236.0/1228.0. Therefore, despite what the higher-timeframe structures suggest at the moment, going long right now might not be such a good idea.
Our suggestions: While entering long may be attractive in respect to the bigger picture, buying into the mess seen on the H4 chart is just too risky for our liking! For that reason, our desk has decided to remain on the sidelines today and will look to reassess structure going into Tuesday’s open.
Levels to watch/live orders:
- Buys: Flat (stop loss: N/A).
- Sells: Flat (stop loss: N/A).